Blog
OpenEnergyMonitor

emonGLCD V1.4

Introducing the current version of the emonGLCD. This post is a bit later than planned, we have actually been selling the V1.4 through the shop for the past month or so. This version features some minor incremental improvements rather than a new design. 

The main changes to this revision are:
  • This LCD power is connected to the 3.3V rail instead of instead of 5V. This will fix the problem with the LCD going blank due to over voltage, discussion thread here. *
  • The external power connection now routed through voltage regulator this means it can accept an input from 5-12V
  • The push switches are now active high, each with their own 10K pull down resistor, R7 and R8 are two additional 10K pull down resistors. 
The emonGLCD sketch examples on GitHub have been modified to work on the V1.4 as default. If you have V1.3 then you will need to uncomment the line that enables the internal pull up resistors (line 116 in emonGLCD_HEM) You will also need to comment line 199 and uncomment line 200 to change the action to active high rather than active low.

All other functions work exactly the same as previous emonGLCD versions. 

See the bottom of the main emonGLCD documentation page for a full change-log detailing the different versions over time. 

*Running the LCD at 3.3V instead of 5V is now within spec for the LCD unit, however running the LCD at a lower voltage did flag up an error in the orientation of C13 and C14 see forum discussion thread here. A note has been added to the build guide to instruct the insertion of C13 and C14 the opposite way round to what is marked on the PCB. 

emonGLCD V1.4 - Assembled (RFM12B missing)
emonGLCD V1.4 PCB - Front
emonGLCD V1.4 - Rear
The emonGLCD SolderPad page has been updated with the V1.4 Schematic and Board files: http://solderpad.com/openenergymon/emonglcd/

Triac based MK2 PV Controller by Calypso Rye


Calypso Rye writes:

Based on the standard VI sketch which uses calcVI() in EmonLib, I’ve had a system in place for the last couple of months which diverts surplus PV power to our immersion heater. This system has proved to be both effective and reliable, and I am most grateful for everyone who has helped me along the way. The main downside to this arrangement is that it requires an expensive item of third-party kit to distribute the power. (I know that others have found cheaper ways, but my Carlo Gavazzi unit cost me £70).

Other contributors to this forum have shown that a standard triac can be easily controlled by an Arduino. By using a zero-crossing detector such as the Motorola MOC3041, it should be possible for the Arduino to allocate mains cycles directly to the load rather than delegating this task to a separate device.

A Mk2 system of this type has been working in our garage for the last few days. The sketch and a schematic diagram are attached, its main features being:

- a comprehensive 'debug' mode which allows real world conditions to be simulated ;

- a continuous mode of operation, for both measurement and distribution of power;

- an "energy bucket" concept which gives precise control of surplus power;

- interleaved windows for measurement and generation, each only 20mS;

- a rapid response time to changing conditions (50mS);

- suitable timing for 'arming' a zero-crossing trigger device;

- a single LPF which determines the dc-offset of raw VI samples;

- a programmable safety margin for biassing import v. export;

- minimal calibration is required.

Read the full post on the forum here: http://openenergymonitor.org/emon/node/841

Single AC power supply + voltage sensing

The idea of using the same AC-AC power adaptor for both sensing voltage and supplying power to emonTx has been discussed on the forums for months (see this topic), and about six weeks ago Glyn posted a simulation of a possible circuit.

I had the time this weekend to give it a try, bought the necessary components and put it all on a breadboard. After a sleepless night I can confirm: It works!

Here is my messy setup:


Small modifications had to be made to get it to work: I added a 1uF cap between 3.3v and GND to filter out some noise and redefined the voltage calibration coefficient in the code.But the main problem (took me all night to figure it out) is that the usual emonTx sketch wont work straight ahead. The line that lights up the LED (on pin 9) at the end of the setup loop has to be commented out, otherwise the setup won't work. It's no problem to flash it 2ms after each packet is sent, but apparently having it on in the beginning will prevent the program from starting. Maybe there isn't enough current to do it and move on (I must say that I use 10k ohm resistors for the voltage dividers). If it's not that then maybe full wave rectification could help.I used a humble Xprotolab to measure the Vin, Vout and at some other points in the circuit. It behaves almost exactly like the simulation. fft also shows very little noise.Would be great if other members could repeat this experiment to see if the results will be the same.Next step: Voltage sensing on the base ;) 

Getting visual

The Open Energy Monitor is all about getting visual. Using hardware to post collected data to emonCMS basically transforms the acquired data into easily understandable informations, and what's better than graphs.
Here is a similar initiative that converts absurd electricity bills into meaningful information:
Source: FastCoDesign.com
You can compare it with with the old bill:


It is obvious that presenting the same information in a different way makes a big difference. The redesigned bill is much easier to understand, and the use of shapes and colors turns something very abstract into tangible information.

But I believe that if we really want to democratize energy monitoring, we should take it one step further. We should offer people who have no idea what 4.2 kW or 150 kWh are, a reference to compare with. For example, visualizing 1kWh as the energy than ten 100W light bulbs consume in one hour makes it understandable to your grandma. Or showing one week's consumption each hour on one matrix using colored circles.

More important is to give a feeling of the order of magnitude. Like showing a community average VS your consumption on a colored scale to have an idea how well you're doing, lets you have a good reference point.

I agree that with households community averages are quite complicated since households have extremely different consumption patterns: some work from home, some have many guests, others spend very little time at home, etc... But when it comes to businesses, benchmarking is much less complicated, you can compare bakeries or cafes electricity consumption patterns in a much meaningful way.

I think this should be a main target to be implemented in emonCMS, and I believe that the community has something to say and contribute to this topic, so I started this forum thread : http://openenergymonitor.org/emon/node/715 please feel free to add your thoughts to it.


Arduino Leonardo (ATmega32U4) and RFM12B


I've just managed to get an RFM12B hooked up to an Arduino Leonardo. It's been a bit of port mapping nightmare!

The ATmega 32U4's  'special function' ports such as PWM, IRQ, SPI etc are quite different to the ATmega328. The Arduino port mapping table proves very useful, if a little difficult to interpret. I made a re-arranged table with the ports re-arranged into function groups. I'll publish it once I've tidied it up.

Once of the main differences is that the hardware ISP connections are no longer on digital pins 10,11,12 and 13. On the Leonardo they are

MISO -  Digital 14
SCK -   Digital 15
MOSI - Digital 16
SS -      Digital 17 

Unlike on the Arduino Uno These SPI pins are not accessible through any of the digital I/O pins, on om the Leonardo, their only accessible through the ICSP header. The SPI SS pin on the Leonardo is not broken out anywhere on the board, strangely it's used for the Rx LED. Can anyone explain why this is the case? It's not a big problem, we can use another pin as SS, digital 10 in this case.

The IRQ Interrupt connection is made to Digital 3 (INT0). This has moved from Digital 2 on the Arduino Uno.

The SEL connection is the same as with the Arduino UNO/ATmega328 goes to digital 10.

See the RFM12B documentation page for general info on RFM12B and details of how to interface with ATmega328: http://openenergymonitor.org/emon/buildingblocks/rfm12b-wireless . 

Arduino Leonardo Connections to RFM12B via JeeLabs RFM12B breakout for level shifting to 3.3V
ICSP Header
Now the hardware is complete it's time to tackle the software. We use the RFM12B driver as part of the JeeLib library from JeeLabs: https://github.com/jcw/jeelib. The library needs to be installed in the Arduino library's folder in the usual way. Arduino 1.0.1 is needed to be compatible with Leonardo.

To make the JeeLib library work with the Leonardo and RFM12B (hooked up as above) the following needs to be inserted into the RF12.cpp file on line 62 before the else // ATmega168, ATmega328, etc.


No change to RFM12.cpp is needed, just download the latest version, see update below.

#elif defined(__AVR_ATmega32U4__)


#define RFM_IRQ     0   //PD0, INT0, Digital3 
#define SS_DDR      DDRB
#define SS_PORT     PORTB
#define SS_BIT      6   //Dig10, PB6


#define SPI_SS      17     // PB0, pin 8, Digital17
#define SPI_MISO    14     // PB3, pin 11, Digital14
#define SPI_MOSI    16     // PB2, pin 10, Digital16
#define SPI_SCK     15     // PB1, pin 9, Digital15


I'm going to send JCW a git pull request to see if these changes can be integrated into the JeeLib library so it should work 'out of the box' in the future.

Update: Pull request has been merged, RF12 part of JeeLib Arduino library now has ATmega32U4 support :-) . Download it here: https://github.com/jcw/jeelib

For a simple RFM12B transmission demo/example see: https://github.com/openenergymonitor/RFM12B_Simple

I'm planning on using the ATmega32U4 in the emonTx SMT that I'm currently working on. Spot the common thread in my last few blog posts!

High Accuracy Current Measurement Over a Wide Range


Measuring the current in a domestic property using a clip-on CT sensor can be quite challenging since the range in which it has to work over is very large, potentially several order of magnitude: up to 25000W and down to a few 10'sW. We would like to have good accuracy over this wide range. 

We have been exploring how to improve on the current emonTx. Robert Wall has written a page detailing the measurement implications of current emonTx ADC resolution at low current values when using the standard 100A max CT sensor and 18R burden resistor. 

A while back we came across an application note from ATmel detailing how to build a fully featured energy monitor using CT sensor, AC voltage measurement and the ATmega328 MCU. App-notes are a fantastic source for open-source hardware information. The ATmel energy monitor app-note is very comprehensive and well written. It's even got a Bill of Materials that specs down to individual resistors complete with their corresponding Farrnel order codes! 

Download the app-note .pdf here: www.atmel.com/Images/doc2566.pdf

Diagram from Atmel app-note - potential divider resistor values where changed to enabled the AC signal to be biased to Vcc/2
The app-note circuit achieves good resolution and accuracy over a wide range by having a adjustable op-amp gain stage. Using the resistor values in the inverting op-amp the gain can be switched from -1.25, -10.26 and -69.11. The gain is switched by digital switching the Bilateral Switches (74HC4066). The gain of the op-amp is calculated as follows:


A couple of days a ago we built up a prototype of the above circuit, more an an exercise to check we can make it work rather than a scientific test, this would be difficult on a breadboard due to the sub-optimal circuit layout. A spare emonTx PCB was used as an easy way to connect the circuit up to an ATmega328 and RFM12B.

Adjustable gain op-amp CT sensor circuit - prototype 

ATmega 328 ADC sample using VI sampler
The circuit worked first time with no hiccups. The above waveform is the RAW output from an ATmega 328's ADC, where one 100W light bulb and 30W laptop PSU was connected to the AC circuit being monitored. The high gain stage (x69.11) was active. To put this in perspective if the same sample was run on the current emonTx the signal would be so small as to be only just visible on the VI sampler. The spikes at the peak of the waveform is caused by the laptop's switch-mode PSU. The significantly increased amplitude of the signal will improve accuracy when monitoring low power levels. The app-note suggests accuracy of <1% over a wide range, possibly even better with careful PCB design. 

Although this multi-gain op-amp circuit adds significant complexity over the current emonTx current monitoring circuit it can be added for relatively low cost. One quad op-amp and two quad bilateral switches IC's cost about £1, this is enough for 4 x CT channels. We're planning to use this circuit design in the forthcoming emonTx SMT. As the name suggests this board will be designed for SMT components and will be assembled by pick-and-place. See this forum thread for a discussion regarding ideas for the emonTx SMT. Design is progressing well, more details on this soon. 

Installing emoncms on a raspberry pi

Update: we now have a more complete guide for installing emoncms on the Pi here: http://openenergymonitor.org/emon/emoncms/installing-ubuntu-debian-pi

Just got emoncms installed and running on the raspberry pi here, here are my installation notes:


1) Initial setup
Download the debian squeeze image from: http://www.raspberrypi.org/downloads and write to an SD card, following the guide here: http://elinux.org/RPi_Easy_SD_Card_Setup.

Insert the sd card into the pi, power it up connect up a screen, a keyboard and ethernet.

2) Enable SSH (optional)

You may at this point like to enable ssh in order to do the rest of the setup remotely from your 'normal' computer (running the pi in headless mode). I followed this guide, http://fusionstrike.com/2012/setting-ssh-ftp-raspberry-pi-debian. The main steps are:

$ sudo bash (Not sure if this is needed, apparently it is useful when performing a series of administrative tasks)

Crease a public RSA key:

$ ssh-keygen -t rsa

It will ask where you would like it saved and a pass-phrase, skip these questions by pressing enter. Once finished and the pattern has appeared enter the followin to enables ssh at boot:

$ sudo mv /boot/boot_enable_ssh.rc /boot/boot.rc

Then to start ssh:
$ sudo /etc/init.d/ssh start

Find the IP address of your pi ($ ifconfig -a) and then from your computer login to the raspberry pi via ssh, for example:

$ ssh [email protected]
(password: raspberry)

3) Update repositories
It may be worth making sure that all packages are up to date at this point:

$ sudo apt-get update

4) Install mysql

$ sudo apt-get install mysql-server mysql-client

When the blue dialog appears enter a password for root user, note the password down as you will need it later.

5) Install apache2

$ sudo apt-get install apache2

If apache fails to start (as it did for me) run the following:

$ sudo groupadd www-data
$ sudo usermod -a -G www-data www-data

6) Install php

$ sudo apt-get install php5 libapache2-mod-php5

$ sudo apt-get install php5-mysql

7) Enable mod rewrite

$ sudo a2enmod rewrite

$ sudo nano /etc/apache2/sites-enabled/000-default

Change (line 7 and line 11), "AllowOverride None" to "AllowOverride All".
Save and exit.

8) That completes the server installation, restart the server to make everything above operational:


$ sudo /etc/init.d/apache2 restart

Installing emoncms:

7) Install git (optional)

$ sudo apt-get install git-core

Follow this tutorial on creating keys etc:
http://help.github.com/linux-set-up-git/

Finally to download, in the /var/www folder type:

$ git clone [email protected]:openenergymonitor/emoncms3.git

Alternatively download emoncms and unzip to your server:
https://github.com/openenergymonitor/emoncms3

8) Create a MYSQL database

$ mysql -u root - p

Enter the mysql password that you set above.
Then enter the sql to create a database:

mysql> CREATE DATABASE emoncms;

9) Set emoncms database settings.
In the folder emoncms3/Includes rename default.settings.php to settings.php. In settings.php enter your mysql username (root) and password, host (localhost) and database name (if as above - emoncms).


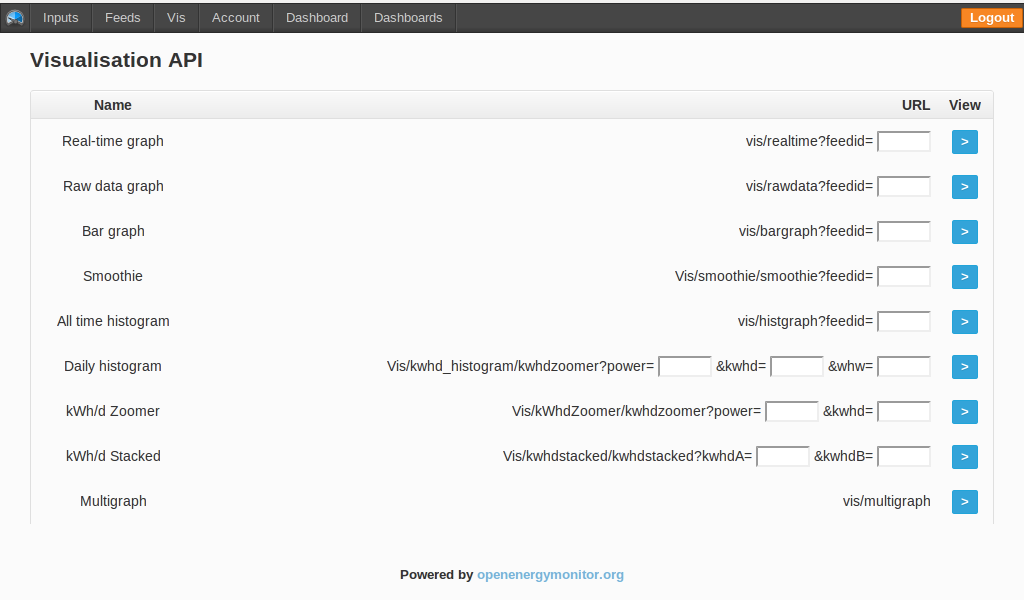
10) In an internet browser, load emoncms:

http://YOURIP/emoncms3

That's should be it!

Next step is to get a jeelink running to receive and forward data from the emontx to the emoncms installation. Will update shortly.

emonTx single AC power supply - Part 1 Simulation

The current emonTx V2.x can monitor AC voltage, real power, power factor and direction of current flow, this is possible by using a plug-in 9V AC-AC transformer to provide a stepped-down AC voltage waveform. See Measuring AC Voltage with an AC to AC power adapter in the building blocks section for more details. The emonTx also requires an additional (separate) DC power source, this is usually provided by a 5V USB plug-in adaptor.

Obviously it's desirable to do away with one of the power supplies and to use the AC-AC adapter to provide both the AC signal and the DC power to the emonTx. Early tests indicated that using the AC signal to provide a DC power supply adversely effected the quality of the AC signal and therefore the voltage and real power reading of the emonTx. Full wave rectification with a bridge rectifier creates a power supply with floating supply rails and loading the AC-AC adaptor caused distortion of the AC sine wave sample signal.

There has been an interesting form thread on the topic of using a single AC power supply for the emonTx. There were number of suggestions for circuits to achieve this. Many of the circuits suggested looked feasible but some added considerable complexity and components such as centre-tapped or isolating transformers. We are keen to use an off-the-shelf certified power supply unit wherever direct connection to mains power is involved. 

Recently Robert Wall contacted us with a single AC power supply circuit design based on a half-wave rectifier and LDO linear voltage regulator. The circuit only requires an additional two capacitors, two diodes and one resistor to supplement the components we already have on the emonTx PCB. Robert has been very helpful offering his expertise and experience as an Electronic Engineer to the project. The technical testing report on the SCT-013-000 CT and Mascot AC-AC adapter in the building blocks section are all Robert's work. 

Note: this circuit design is still in development, we are currently at the simulation stage

Fig1. Half wave rectifier AC-DC power supply and AC voltage sample 
The key to Robert's circuit is current limiting resistor R1, this limits the current draw from capacitor C1. The resistor value was chosen to attempt to charge C1 gradually over the positive half cycle. See the labelled waveforms below to see how this works in practice simulation! C2 is a de-coupling capacitor and R3-R5 reduce the AC sample to the correct magnitude and bias ready to be sampled by the ATmega328 ADC. 
Fig2. Simulation waveforms under normal operating conditions
To demonstrate the effect of the current limiting resistor R1 the simulation was ran with R1= 1 ohm, see the labelled waveforms in Fig.3 below. The capacitor C1 now charges up quicker drawing more current from the AC-AC adapter, this loads the adapter creating a 'dip' in the AC sample waveform. This will negatively effect the voltage and real power reading on the emonTx. 
Fig. 3 Demonstrating the effect of low value current limiting resistor R1
Simulation has indicated that with a current draw of about 8mA (ATmega328) and using the Mascot AC-AC power adapter with a mains voltage of about 240Vrms results in a -6mV difference in the Vrms of the sample waveform when compared with a perfect sine wave. This should be small enough to not adversely effect the AC voltage and real power reading, a tweaking of the calibration will probably be required.

The next step is to move beyond the virtual; build up a prototype to see if it performs in practice like the simulation suggests!

I've posted the LTspice simulation files used to generate the simulation waveforms on the forum: http://openenergymonitor.org/emon/node/704

View your power data as a histogram in emoncms

This blog post details how to view your power data as a histogram in emoncms. This is a really useful feature implemented in emoncms by Paul Allen http://wattdata.blogspot.com  (MarsFlyer on Gitub: https://github.com/MarsFlyer). So a really big thank you to Paul for this!

The histogram shows the energy (KWh) used at a particular power (watts) which allows analysis of what types of devices (low / medium / high) are using the most energy. 

Here is the histogram visualisation for my house, embedded directly from emoncms.
Click on a particular day to see a histogram of that day:

Viewing your power data as a histogram

1) Send power data to emoncms see here for details of doing this with an emontx and emonbase: see Build a home electricity energy monitor


2) Click on the power input to bring up the input configuration page. Set up processes as in the screenshot, one power process, one kwhd process and one histogram process:


3) Click on Feeds to bring up the feed/list page, click on the histogram feed:


4) In the histograms feed/view page click on the graph type histogram:


5) Once you have been logging histogram data for a few hours you will start to see histogram bars form at the different levels of power that you use. This histogram graph shows energy used at a particular power for all time. So is a really useful tool for measuring what is the total energy used by the electric immersion water heater for example, we've used 62 kWh @ 3500W since April 13th.


6) To view your histogram data at a daily basis as in the first embedded visualisation above enter your feed id's and apikey in the following emoncms visualisation url:

http://vis.openenergymonitor.org/emoncms3/Vis/kwhd_histogram/kwhdzoomer.php?apikey=YOURAPIKEY&power=1&kwhd=2&whw=3

All the source code for the histogram functionality is available in the main emoncms3 repository on github http://github.com/openenergymonitor/emoncms3

Paul Allen has achieved some remarkable reductions in energy use over the last 4 years and uses a version of the histogram beautifully to visualise the changes, see his blog post here: Personal experiences of saving 42% on my electricity use