Blog
OpenEnergyMonitor

Emontx Shield SMT with new layout in development


Several weeks ago we got an email with a series of pictures showing the problem that the emontx shield does not stack well with many of the base boards and other shields it may be used in conjunction with.

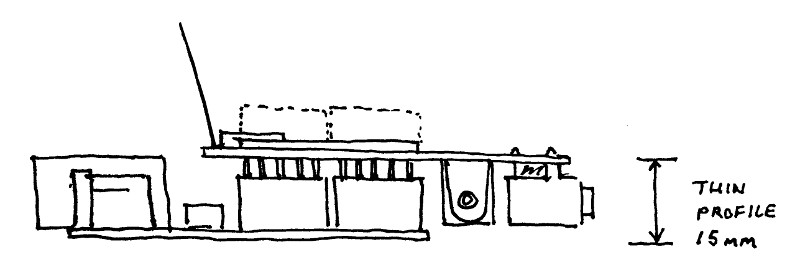
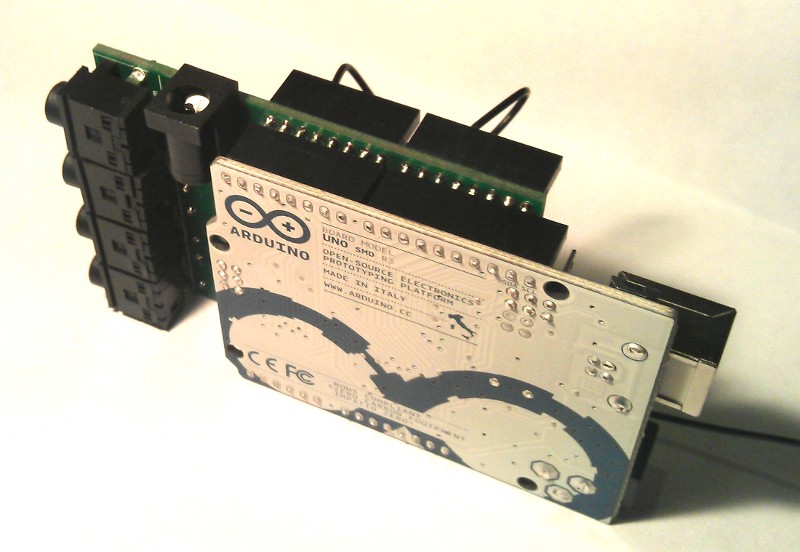
It got me thinking about different ways the shield could be arranged that would make it stack better with a variety of different boards. The main idea I had was to move the AC-AC Adapter and CT inputs over to the other side of the PCB away from the side the Ethernet and USB sockets are usually located on most of the Arduino boards and the NanodeRF. The second idea was to mount these sockets on the underside of the PCB which allows for a really thin profile NanodeRF + EmonTx shield stack which I think is pretty neat if a little unconventional. Here's the concept drawing:

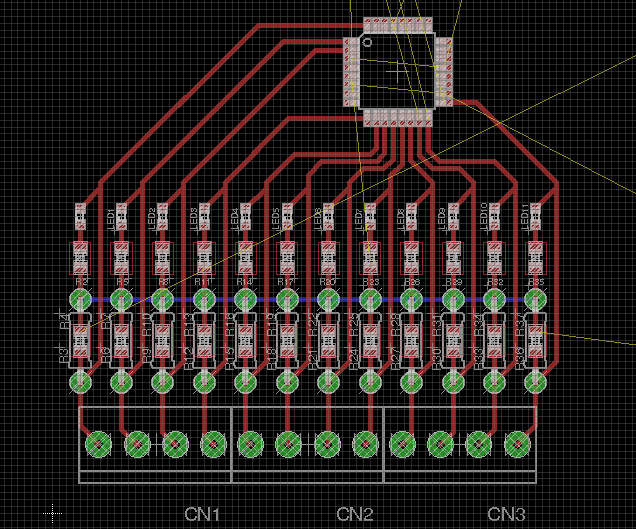
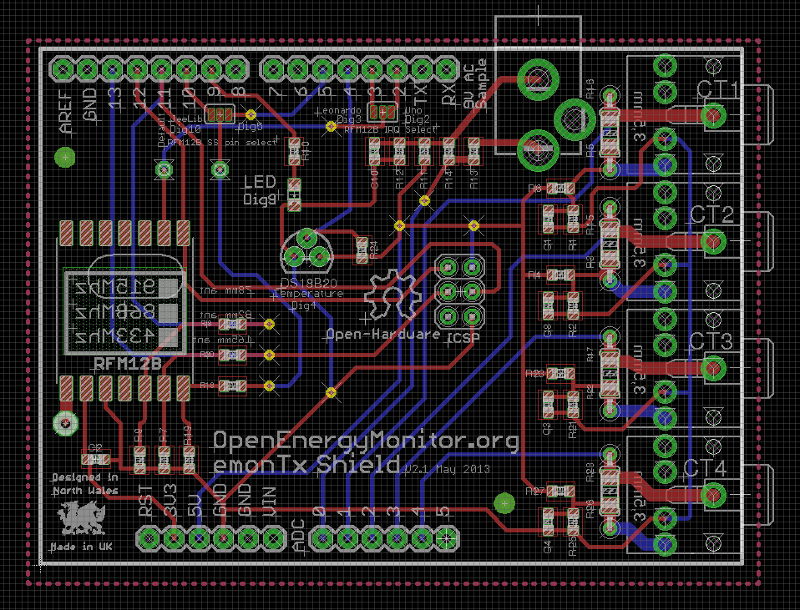
As you may be aware I have not really ventured into PCB design much before (I usually work on software) but its been something I wanted to do for a while so I thought Id have a go at the emontx shield redesign as its one of the simplest layouts. With Glyn's helpful guidance I started by loading the existing schematic and board files for the through hole emontx shield in eagle, I then ripped up all the existing PCB tracks, rearranged the components in different layouts and switched the resistors and capacitors over to SMT packages. Here's a screenshot of the resultant board design:


I spend most of my dev time writing lines of code which becomes a visual output in a second step, PCB design is a different experience as its all immediately visual, dragging and dropping pcb tracks, trying to see if this track that way or another in its place looks neater, its a nice change. If your intrigued to have a go I'd recommend installing eagle, loading up one of the board designs that are all up on solderpad and experiment with routing tracks, maybe adding/removing a temperature sensor.

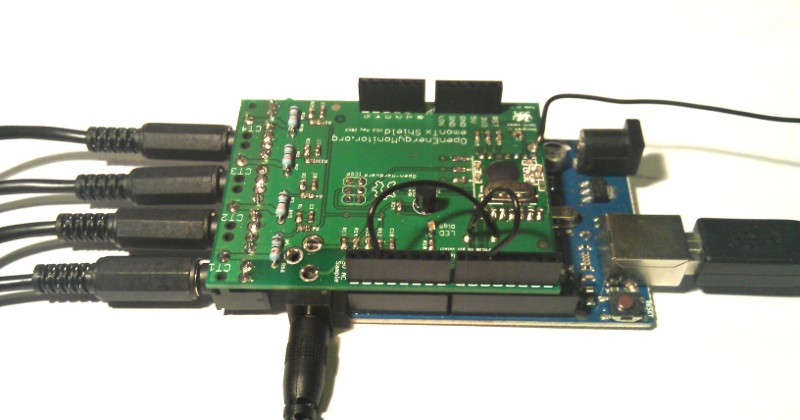
The PCB's arrived on Tuesday, I built it up and have started to test it, so far everything seems to be working, energy monitoring part, RFM12, Led, DS18B20 temperature sensor, Arduino Uno, Arduino Duemilanove. Next I will test the NanodeRF and Id also like to test an Arduino official Ethernet shield.


Things to improve
There is a very slight misalignment on the ISP header that needs fixing although it still stacks together fine and Glyn pointed out that the option to choose different SS (SEL) and IRQ pins for the RFM12 could be achieved using a manual jumper rather than solderable pads. Id also like to add a terminal for the DS18B20 on the edge of the board for neater connection of temperature sensor strings.

Once these are fixed we will get a run of boards made, it will probably be another month or two at least until its in the shop as these things take time.

Open Hardware Schematics and Board files
All available on solderpad here:

Removing redundant datapoints – algorithm 1


You could probably say that the aim of an algorithm that removes redundant datapoints is to create a line plot who's standard deviation compared to the raw data line is as small as possible while minimising the number of datapoints. This is probably a good rough criteria for evaluating a prospective algorithm.

Here's one idea for an algorithm, I think it can certainly be improved upon but its a start.

If we start with our monitor that's posting once every 10 seconds. If we note down the first datapoint received and then as subsequent datapoints come in draw a line between the first and the last datapoint.
Then lets say there is a step change, a light goes on, suddenly the line is much higher than the actual data for most datapoints:
If we measure the standard deviation of the raw datapoints vs the line to begin with it will be small, once that step change happens it will become much larger.

At this point we note a significant change has happened (stdev is larger than a threshold) and create a datapoint one back from the last datapoint (the bottom of the step).

We can then move our 'start' datapoint forward to this created datapoint and repeat the process. This should do a pretty good job of tracking the raw data.

To test it I have created a visualisation that applies this algorithm using javascript in the browser here is the result:


It works pretty well reducing 1064 datapoints to 52, but it does look messy in places.
To try out the code for the above, make a backup of the script:

emoncms/Modules/vis/visualisations/rawdata.php in your local emoncms installation. 

and replace with this:


If you can think of a good algorithm to do this, It would be great to hear about it.

Removing redundant datapoints - part 1


As I mentioned before another idea for reducing disk use is compression by removing redundant datapoints. Describing our plot with the least possible number of datapoints. Before energy monitoring I first learnt programming writing some basic 3d games and physics simulations using OpenGL, I was always fascinated by trying to create 3d landscapes, one of the techniques used to generated large landscapes is called level-of-detail terrains where you increase the polygon count where there is lots of detail I.e a mountain ridge or reduce the polygon count where there isnt ie a flat plain. I've been wondering for a while whether a similar approach could be taken to describe timeseries data so we increase the datapoint rate where there is a big change (ie when the kettle, light, fridge goes on) so that we get that event exactly at the right point in time and reduce the rate when not much is happening.

I tried to do something along these lines a few years back where the hardware would only post to the server on a step change in the power signal, the code is still up here as part of the appliance inference work I was experimenting with: http://openenergymonitor.org/emon/buildingblocks/appliance-inference

The problem was that it was failing when events happened too frequently, ie a thermostat controlled cooker cycling on and off. The event detection algorithm relied upon two 5 datapoint segments next to each other, when the difference between the average of the segments where larger than a threshold an event would be registered. A 10 datapoint segment spanning ~ 100s at 10s per datapoint or 50 seconds at 5s is too large and will miss events that happen to frequently. The other problem with this approach is that it wont work for temperature data which is more a change of gradient than power data steps.

Anyway with the problem of large emoncms disk space demand I have been thinking about this idea again. Could it be used to reduce disk space use significantly without loosing vital timing on events that would happen by just reducing the post interval rate. I had a good conversation with the guys at houseahedron https://twitter.com/Housahedronwho came to visit last week about this, they had been thinking along similar lines and saw parallels with an approach used in path plotting, they took a couple of example datasets back with them to see if they can find a way to parse it.

The screenshot below shows the solar hot water pump coming on for 40 mins at the beginning of a bright sunny day. The raw data would use 720 datapoints at a 10s post interval to describe the plot. Overlayed on the raw data plot I have drawn a second line that only has datapoints where needed to keep the standard deviation between the lines roughly within an acceptable limit, in this case 10 datapoints seems to be enough to do this. If this kind of datapoint reduction rate is typical then a 60Mb mysql table with the current emoncms implementation might only take up 0.83Mb of space per year.


Zooming in a bit, rather than 270 datapoints, this could be described with 8. (at this datapoint reduction rate 60Mb would compress to ~1.8Mb)


In addition to reducing disk space, it may be possible to use this technique to increase the resolution of our measurement as we are oversampling in regions where there are no large changes

This atmel appnote describes how to use oversampling and decimation to achieve greater measurement resolution:

I think there are two main development questions facing this idea:
  1. Can a good enough algorithm be developed to compress the data while retaining the detail we want.
  2. What are the implications for data query speeds?
The above said, I think timestore looks like the leading solution at the moment for data storage and fast query speeds. With timestore we can achieve an 80% reduction in disk space demand from 60Mb per 10s feed per year to 12.3 Mb, this would reduce the disk space use on emoncms.org from 47GB to 9.6GB, disk space use would increase at 20GB per year (costing £96 per 20GB stored inc backup instead of £480/year) and most of its already there in terms of implementation.

It might just be interesting to explore the datapoint reduction idea in parallel to see if further disk space reductions can be achieved but without sacrificing on query speeds which is the open question. If feeds could be compressed to 1.8Mb from 60Mb emoncms.org disk use would shrink from 47GB to 1.2GB and disk space would increase at a rate of 2.6 GB a year which would make server disk space costs pretty negligible.

Timestore timeseries database

The first and most developed solution to both the query speed problem and disk space problem is timestore.

http://www.mike-stirling.com/redmine/projects/timestore

Timestore is a lightweight time-series database developed by Mike Stirling. It uses a NoSQL approach to store an arbitrary number of time points without an index.

Query speeds
Timestore is fast, here's the figures given by Mike Stirling on the documentation page:

From the resulting data set containing 1M points spanning about 1 year on 30 second intervals:

Retrieve 100 points from the first hour: 2.6 ms
Retrieve 1000 points from the first hour (duplicates inserted automatically): 6.2 ms
Retrieve 100 points over the entire dataset (about a year worth): 2.5 ms
Retrieve 1000 points over the entire dataset: 7.0 ms

Disk use

Timestore uses a double as a default data type which is 8 bytes. The current emoncms mysql database stores data values as floats which take up 4 bytes, its easy to change the data type in timestore so for a fair comparison we can change the default datatype to a 4-byte float:

Layer 1: 10s layer = 3153600 datapoints x 4 bytes = 12614400 bytes
Layer 2: 60 layer1 datapoints averaged = 52560 datapoints x 4 bytes = 210240 Bytes
Layer 3: 10 layer2 datapoints averaged = 5256 datapoints x 4 bytes = 21024 bytes
Layer 4: 6 layer3 datapoints averaged = 876 datapoints x 4 bytes = 7008 bytes
Layer 5: 6 layer4 datapoints averaged = 146 datapoints x 4 bytes = 1168 bytes
Layer 6: 4 layer5 datapoints averaged = 36 datapoints x 4 bytes = 288 bytes
Layer 7: 7 layer6 datapoints averaged = 5 datapoints x 4 bytes = 40 bytes

total size = 12854168 Bytes or 12.26Mb

The current emoncms data storage implementation uses 60Mb to hold the same data as it saves both the timestamp and an associated index. Timestore therefore has the potential to reduce diskuse by 80% for realtime data feeds.

Interestingly all the downsampled layers created by timestore only come too 0.23 Mb. Before doing the calculation above I used to think that adding all the downsampled layers would add to the problem of disk space significantly but evidently it a very small contribution compared with the full resolution data layer.

Emoncms timestore development branch

I made a start on integrating timestore in emoncms, there's still a lot to do to make it fully functional but it works as a demo for now, here's how to get it setup:

1) Download, make and start timestore

$ git clone http://mikestirling.co.uk/git/timestore.git
$ cd timestore
$ make
$ cd src
$ sudo ./timestore -d

Fetch the admin key

$ cd /var/lib/timestore
$ nano adminkey.txt

copy the admin key which looks something like this: POpP)@H=1[#MJYX<(i{YZ.0/Ni.5,g~<
the admin key is generated anew every time timestore is restarted.

2) Download and setup the emoncms timestore branch

Download copy of the timestore development branch

$ git clone -b timestore https://github.com/emoncms/emoncms.git timestore

Create a mysql database for emoncms and enter database settings into settings.php.

Add a line to settings.php with the timestore adminkey:
$timestore_adminkey = "POpP)@H=1[#MJYX<(i{YZ.0/Ni.5,g~<";

Create a user and login

The development branch currently only implements timestore for realtime data and the feed/data api is restricted to timestore data only which means that daily data does not work. The use of timestore for daily data needs to be implemented.

The feed model methods implemented to use timestore so far are create, insert_data and get_data.

Try it out

Navigate to the feeds tab, click on feed API helper, create a new feed by typing:
http://localhost/timestore/feed/create.json?name=power&type=1

It should return {"success":true,"feedid":1}

Navigate back to feeds, you should now see your power feed in the list.
Navigate again to the api helper to fetch the insert data api url

Call the insert data api a few times over say a minute (so that we have at least 6 datapoints - one every 10 seconds). Vary the value to make it more interesting:
http://localhost/timestore/feed/insert.json?id=1&value=100.0

Select the rawdata visualisation from the vis menu
http://localhost/timestore/vis/rawdata&feedid=1

zoom to the last couple of minutes to see the data.


I met Mike Stirling a little over a month ago in Chester for a beer and a chat after Mike originally got in contact to let me know about timestore. We discussed data storage, secure authentication, low cost temperature sensing and openTRV the project Mike is working on. I think there could be great benefit to work on making what we're developing here with openenergymonitor interoperable with what Mike and others are developing with openTRV, especially as we develop more building heating and building fabric performance monitoring tools. This could all develop into a super nice open source whole building energy (both electric and heat) monitoring and control ecosystem of hardware and software tools.

Check out Mike's blog here:

http://www.mike-stirling.com/
and http://www.earth.org.uk/open-source-programmable-thermostatic-radiator-valve.html

The current emoncms feed storage implementation

Following on from the last blog post on emoncms.org server load and disk use, lets look at the current emoncms implementation of feed storage in a bit more depth before going on to look at how it can be improved.

Emoncms currently stores realtime feed data in a mysql database, every feed has its own mysql table. A feed table contains two fields: timestore and data value. Feed data is usually on a regular time interval, ie: 5,10,60s data. The time interval is set by the posting sensor node rather than emoncms.

Calculating feed disk use
We can calculate the estimated feed table size using the current implementation used in emoncms.

Lets say we want to store a year of 10s data. There are 31536000 seconds in a year and so 3153600 datapoints at a 10s data rate.

A single datapoint is made up of a timestamp which is stored as an unsigned integer, which takes up 4 bytes, and a float data value which also takes up 4 bytes.

3153600 datapoints x 8 bytes per datapoint (table row) = 24 Mb

In addition to the feed data we also have a table index which speeds up queries considerably. The worst case index size can be estimated with the equation detailed on this page:

http://dev.mysql.com/doc/refman/5.0/en/key-space.html

index row size = (key_length+4) / 0.67

The key we are using is the time field which is 4 bytes and so the index row size is = (4 + 4) / 0.67 =~ 12 bytes

The index size for 3153600 datapoints is therefore approximately = 3153600 * (4 + 4) / 0.67 = 36Mb

The total feed table size will therefore be approximately 60Mb.

Feed query speeds
As emoncms has developed a fair bit of work has gone into improving the method that realtime data is queried. At first improvements seem promising, see this documentation page for detailed discussion on the query implementation and query speeds:


But growing server demand on emoncms.org and feed table size means they have often only staved off an eventual slow down. 

I think the last idea I had of using a php for-loop to request a single row at given intervals that originally  reduced query times by about 10x is no longer working well on emoncms.org, it still gives the 1.6s query time on my local installation of emoncms but on emoncms.org Im getting a mixture of short query times 500ms and much longer query times 20s+ (in the more than 55 hour timewindow). The reason for this I think is due to the php for loop having to wait when the server is under heavy load for other mysql queries to complete. I think another solution is needed.

In the next few blog posts I will look at some of the potential solutions to both disk use and query speeds.

Emoncms.org load stats

You might be wondering what kind of load is on emoncms.org, maybe you have experienced it slow down from time to time and then other times be much faster, maybe your just intrigued about how much its used and what are the challenges with hosting a site like this. So what better way to investigate the load on emoncms.org that use the visualisation features built into emoncms itself.

This first graph is of server load since late January 2013 as recorded by the command 'uptime'. You can see a clear drop in load on the 16th of March where the re-factored emoncms v5 was introduced with its reduction in mysql queries in input processing:

On a shorter time scale the load fluctuates at what seems to be periodic intervals with a significant spike every 10-12 minutes, a load of 3 is enough to make emoncms feel slightly sluggish on feed data requests.

This graph shows the number of feeds that where updated sometime in the last 5 minutes (not the number of feed updates in the last 5 mins which is much higher). I use this graph to check that an emoncms update has not caused a big drop off in active feeds, I check to make sure that the number of active feeds returns to the same level after an update.

The number of active feeds has grown from around 1350 to 2100 (750) since early March 2013, just over 300 new active feeds a month. The total number of feeds created in all time is 15660 a portion of these will have been deleted and replaced with new feeds, a portion will just be inactive.

Zooming in again on the last 4 hours shows that there are about 120 feeds that are updated on a longer than 5 min timescale and there doesn't seem to be a clear correlation between the server load spikes above and the update spikes here. Maybe some kind of mechanism to even out the load could be a beneficial feature to look into.


The next graph is the last server load related graph, it shows the time in seconds taken by the server to serve all requests, you can see again the time saved by the emoncms v5 implementation of input processing (the change of gradient on the 16th of March). High load events are also clearly visible as steps, some of these events made emoncms.org unresponsive for quite sometime, one of the larger high load events lasted 40 mins.


Emoncms.org disk use

Apart from load spikes, disk use is probably the most pressing concern with emoncms.org and probably emoncms in general. Disk use is growing pretty fast rising from 22GB at the start of February to 47GB now at the end of May. The vast majority of this is realtime feed data. I need to measure for certain but I think all the other tables including daily averages and histogram data come to only a few hundred MB.


Disk use is rising at about 280 Mb a day so about 100 GB a year, disk space is charged for on a monthly basis (£2 per month for 10GB http://www.bigv.io/prices). For every 100GB stored the annual cost would therefore be £240 per 100GB per year without backup and £480 a year with second bigv server used for backup, so even if the number of feeds that are posting to emoncms.org stay constant and there are no new users, disk use costs for existing users will continue to rise if historic data is retained in its current form.

Luckily there are several potential solutions to this which I will come back to in another blog post, the most promising one being a method of compressing the data without loosing the vital time resolution on feed events. Essentially removing redundant datapoints, only preserving datapoints where changes are happening. This should be a beneficial feature for raspberry pi installations of emoncms as well where disk space is also at a premium.

So to summarise, I think there are two design challenges identified above that would be good to tackle going forward with emoncms:

- How to identify the source of and either distribute or limit the effect of whatever is causing load spikes.
- How to fix the disk space use problem.

While fixing these it would also be good to reduce query times and retain the vital resolution on feed events.

Apart from challenges the above graphs show the success of emoncms.org which is exciting, its great to see people use it, that's really encouraging. Lets keep rising the bar with what's possible with a fully open source cloud application energy monitoring service.

Recent commits to emoncms


There have been many great recent commits to emoncms thanks to PlaneteDomo, Baptiste Gaultier, Simon Stamm, Erik Karlsson (IntoMethod), Bryan Mayland (CapnBry), Ildefonso Martínez, Paul Reed and Jerome. Including improved translations, ability to translate javascript, query speed-ups, a working remember me implementation and work on the raspberry pi module. I thought Id write this blog post to draw attention to the great contributions that are being made and so that credit goes where its due:

Summary of additions:

PlaneteDomo - Implementation of a clean way of adding ability to translate text previously defined in javascript https://github.com/emoncms/emoncms/pull/72

Baptiste Gaultier (bgaultier) - A lot of French translation work

Simon Stamm - Added ability to display yen and euro in zoom visualisation, including an option to place the currency after the value ( 1 = after value, 0 = before value)
https://github.com/simonstamm/emoncms/commit/39af426ecd9eabffefbc12712bfea9ed2503a5f5
and fixed issue with floatval and json_decode: https://github.com/emoncms/emoncms/pull/78

Erik Karlsson (IntoMethod) - Fixed dashboard height issue, thanks to Paul Reed for reporting this bug on the forums: http://openenergymonitor.org/emon/node/2013

Addition of async ajax calls for some visualisations https://github.com/emoncms/emoncms/pull/71 this makes the dashboard feel alot snappier and page load is about 4-5 times faster.

Also a really significant fix that I've been really enjoying, Erik Karlsson fixed the remember me implementation that I failed to get to work properly: https://github.com/emoncms/emoncms/pull/69

Bryan Mayland (CapnBry) - Improved feed/data request query times: https://github.com/emoncms/emoncms/pull/63 adds a 3rd query type using the mysql average method for times less than 50 hours (180,000 seconds).

Ildefonso Martínez (ildemartinez) - javascript code re-factoring

Paul Reed - tab between fields when logging in, average field in visualisations moved to the right.

Jerome (Jerome-github) A lot of work on the RaspberryPI emoncms module including continued work on the python gateway script. For ongoing discussion on raspberrypi module development see the github issues page here: https://github.com/emoncms/raspberrypi/issues/30

Id really like to thank these guys and everyone who continues to help out with development, there's a lot of hard work going in that's really pushing things forward.

Emoncms.org backup

I'm happy to announce that emoncms.org is fully backed up and has incremental backup implemented, all data is incrementally backed up once every 24 hours, a backup cron job runs hourly syncing 640 feeds each time so 15360 feeds every 24 hours. emoncms.org disk use is currently growing at a rate of about 300MB a day and the transfer format is csv which gives you an idea of the volume of data that the backup implementation needs to sync. The total volume of data I have synced so far using this is 49 GB.

The backup implementation uses many of the things already developed as part of the sync module which allows you to download feed data from a remote server. I've put the full emoncms backup script in the tools repository on github here:

https://github.com/emoncms/usefulscripts/blob/master/backupemoncms.php

For the above script to run, you need to first copy the users and feeds table from the master server to the backup server using the more common backup procedure of using mysqldump and scp, the steps to do this are described in the header comments of the backup script.

This method of backing up is much faster than using rsync which I originally tried for incremental backup as it does not go through each feed looking for changes it just checks when was the last datapoint in the backed up feed and downloads every new datapoint from the master server recorded after that time, one disadvantage of this is that any changes to feed data using the datapoint editor tools in emoncms will not get updated to the backup server. It would be good though to make it possible to delete data on the backup server if its deleted off the master server, as disk space is expensive and if you delete data off emoncms.org you would expect no copy to remain from a data privacy point of view.

I implemented the backup system like this because I had most of what I needed already in place in the sync module and so it was the quickest way for me to get this up and running using what I already knew. I'm aware the database replication can be performed with mysql replication, where a transaction log is stored on the master server and transferred to and then executed on the backup server. I'm interested in exploring this option too and if anyone can tell me that using mysql replication will offer significant performance benefits over the method above and why, that would certainly motivate me to look at it sooner.

I'm still reluctant to guarantee data on emoncms.org as both vm servers are in the same datacenter and they are part of bigv cloud which could even mean that both share the same disk (which would invalidate one of the reasons for a separate backup to protect against disk failure) although bigv suggested that this is unlikely as there are plenty of tails. They recognise this as a weakness and something they hope to change soon.

So if you want extra peace of mind I suggest installing a local installation of emoncms on your own computer and downloading your data periodically using the sync module, I do this both for extra backup and so that I can access the raw data for trying new visualisation and data analysis, processing ideas. I will write a guide on how to do this soon. The sync module is available here:

http://github.com/emoncms/sync

I'm interested in being transparent about how emoncms.org is hosted, so that rather than give opaque promises you can asses things like how its backed up for yourself. You often here people say that no system is absolutely secure and completely safe from failure so I hope that by being transparent about this you can see what has been done. I'm relatively new to administering web services and I'm sure if your a more experienced web admin reading this you may know how this can be done better, I would appreciate hearing how you think it could be improved.


12 input pulse counter idea


A while ago now Glyn and I worked on a design for a 12 input pulse counter, we where doing some work at the Centre for Alternative technology, a stripboard version was built and is in continued use monitoring grid import/export, chp and diesel generator (the last two not actually in active use).

We wrote up about it here:

After visiting CAT again recently and discussing a project they hope to do, it got me thinking again about the 12 input pulse counter. In non-domestic buildings that already have pulse output meters on many of the circuits and a meter room with all the meters in one place, a multiple input pulse counter may be the most effective way to add automatic meter reading.

I've wanted to make a PCB for the 12 input pulse counter for a while so I though I'd do a little work on it this morning, here's a screenshot of where I've got to so far:


Here are the features Im thinking it will have:
  • 12-input pulse counter
  • Optional pull down resistor with option for SMT or through hole, see building blocks pages linked above for why pull down resistors are required.
  • Input status LED, driven by pulse signal.
  • Dedicated ATmega for pulse counting
  • Serial connection to second ATmega used for ethernet or/and rfm12 comms.
  • Enclosed in a DIN rail mounted enclosure.
Here's the eagle design so far:


I used the rfm12pi board design as a starting point as it already had the basic atmega + rfm12 circuit in place. 

One thing I'm still wondering about is whether to add a second optional resistor between the terminals and the pull down resistor which would provide the option of having a voltage divider on the input for stepping down from higher pulse voltages like 24V.

More to come soon..

Continuation of emontx testing - feed comparison tool


Glyn has been running a parallel test of the new emontx v3 vs the old emontx v2 for over a month now. See Glyn's original post introducing emontx v3 here: http://openenergymonitor.blogspot.co.uk/2013/02/emontx-smt-update-introducing-emontx-v3.html

In testing a new emontx version here are a few questions that we would like to answer:

How does emonTx v3 accuracy compare at lower power's?
Is there any difference in low power readings with or without the powered from AC-AC adapter feature?
Can differences be explained by calibration error?
Are there any other measurement variations that need investigating?

To make it easier to compare the parallel test power feeds I though Id create a visualisation tool in emoncms that made it easier to see the difference between the feeds.


If difference is caused by calibration error then applying a calibration to the measured data should bring the difference down close to zero.

Any deviations in measurements that remain should be non-calibration errors, and they will appear off to one side of the linear PowerX vs PowerY plot.

The above visualisation can be viewed here:

This visualisation tool is available in the emoncms visualisations list if youd like to try this on your own monitor, even comparing say two different CT channels on a single emontx.

There are some issues I need to fix with the visualisation tool implementation that gives rise to some incorrect comparisons at some scales to do with the way it selects datapoint id's to compare.

In the next post I will explore differences between the two parallel test power feeds.

On another topic:
One of the interesting things I did yesterday was use the raspberrypi emoncms module on my ubuntu laptop. I used a jeelink connected to the usb port of the laptop and then configured raspberrypi_run.php to connect on port /dev/ttyUSB4 instead of the default raspberrypi port, this could be a useful configuration for anyone who just wants to log data from the nodes locally to their laptop and as Jerome pointed out here, maybe the emoncms raspberrypi module should just be called the emoncms linux board module or just serial interface module.