Blog
OpenEnergyMonitor

emonTH Prototype

I'm currently working on a little unit called the emonTH, a remote temperature and humidity monitoring node. We wanted a tidy looking, easy to deploy little unit for monitoring the environmental conditions in various rooms of our houses. The temperature and humidity data gathered can be fed into emoncms and used for building energy modelling, heating system optimisation etc.

The design so far has got options for DS18B20 temperature sensor or DHT22 sensor for humidity & temperature. External sensors can be connected via terminal block (not soldered in on prototype). The enclosure can be wall mountable. The unit will be battery powered with option for mini-usb power. We have estimated around 6-9 months battery. I hope we might be able to get a year or so battery life with optimization and slowing down the readings to once every few min.

I'm currently testing prototype #1. 

To keep power consumption down the ATmega328 microcontroller is put to sleep in-between reading and the sensors are powered from digital outputs and are turned off altogether in between readings, this should stop any self heating effects (see forum thread), I'm planning to do some accuracy testing on prototype soon.

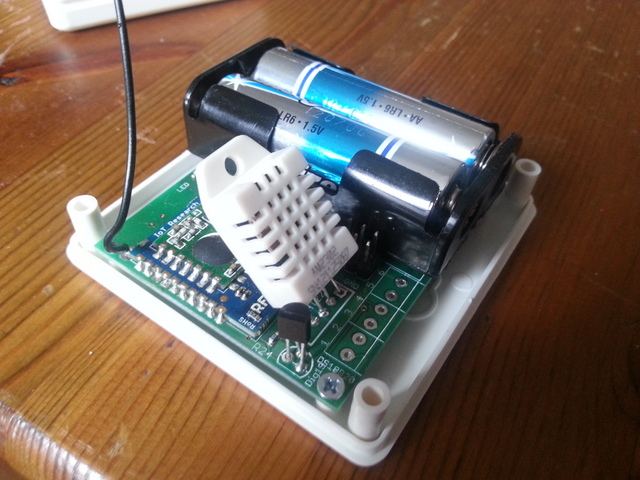
emonTH first prototype with DTH22 and DS18B20

emonTH enclosure

As with other the other OpenEnergyMonitor hardware the emonTH has got an ATmega328 with the Arduino bootloader so it's nice and easy to modify and upload new the code (sketches). For the wireless there is an RFM12B module to be compatible with our other hardware (RFM12Pi base station etc). Again, as with all our other hardware units the schematic and CAD filed will be open-sourced. 

The emonTH uses a little module from Ciseco called RFu328. This unit is an ATmega328 plus a radio RFM12B or SRF in the same small form factor as an Xbee. We decided to use the RFu328 partly because it's nice and small and makes manufacture easier for us and party since it allows to to easily swap between using the RFM12B radio or the SRF while keeping the flexibly and ease of use of the ATmega328 with Arduino Uno serial bootloader. 


RFu328 with RFM12B

The little red circle on the image above indicates the only hardware charge required when using an RFM12B radio on the RFu328. The SMT resistor is rotated routed 90 degrees swapping over Dig 1 SRF UART (Tx ) to Dig3 (INT 1) to be used as the RFM12B SPI interrupt. The RFu328 with the RFM12B requires a modified JeeLib Arduino library called RFu_JeeLib.
RFu328 with SRF & Chip Antenna

Building Energy Modelling: Ventilation and infiltration


Following from the previous blog that described a simple example of heat loss via heat conduction through the building fabric, the second primary cause of heat loss is ventilation and infiltration. The movement of heated air from inside the house into its surroundings.

I wrote the following as a start for the Emoncms SAP module documentation and can be found under emoncms.org/sap/airchange

The rate of air movement is typically measured in air-changes per hour. An air-change is when the full volume of air inside a house is replaced with a new volume of air. This happens surprisingly frequently.

The heat lost is equal to the energy stored in the warm air relative to the external temperature, which can be found with another fundamental physics equation, the equation for specific heat:

HLOSS = c x m x (TINTERNAL - TEXTERNAL)

Where:

c = Specific heat of air (1006 J/kg.K)
m = Mass of air that has moved out of the building per second

(HyperPhysics: Specific heat)

Example:

A house that measures 7 meters wide, 7 meters long and 6 meters high encloses a volume of: 294 m3. The house has an average air tightness for a modern house of around 1.5 air changes an hour and the internal temperature is 20C while the external temperature is 12C.

The first step is to work out the m: the mass of air that has moved out of the building per second. We know the volume of air that has moved and the rate at which the volume moved and so we can calculate the mass from this.

mass of one air change = volume x air density
There are 1.5 air changes per hour or 1.5 / 3600 air changes per second. The mass of air that has moved per second is therefore:

m = (air-change / 3600) x volume x air density
The division by density of air and 3600 and also the multiplication by the specific heat of air is in many models bundled together into one constant to reduce on the calculation steps:

m x c = air-change x volume x (density x c / 3600)
Where:

density x c / 3600 = 1.205 x 1005 / 3600 = 0.336
The heat loss from ventilation and infiltration becomes:

HLOSS = 0.33 x air-change x volume x (TINTERNAL - TEXTERNAL)


This is the form of the equation used in the SAP model in section 4 (emoncms.org/sap/4). 0.336 has been rounded down to 0.33 in accordance with the SAP value. The density and specific heat figures above come from: http://www.engineeringtoolbox.com/air-properties-d_156.html

Entering our example values in the simplified equation, we get:

HLOSS = 0.33 x 1.5 x 294 x (20 - 13) = 1018.71 Watts


Working out air-changes per hour

The hard part in the equation above to work out is of course the air changes per hour of a building. The most accurate way to find it out is to perform an air tightness test of the building. This involves de-pressurising the building with specialist fans attached to the front door.

The SAP model provides a method to estimate the air-change rate in the absence of a measured value. This method is detailed in full in section 2 (emoncms.org/sap/2) and takes into account factors from number of chimneys and flues to wind speed and the degree the building is sheltered from the wind.

Typical air-change per hour values

As a guide Pat Borer and Cindy Harris give the following values in the Whole House Book.

Old undraught stripped house: 4 air changes per hour

Average modern house: 1 to 2 air changes per hour

Very tight, super-insulated house: 0.6 air changes per hour

How much energy does it take to heat a simple cube house?

Imagine a house that is a hollow cube of uniform material, no windows, no openings, no draughts, just a simple hollow cube.

Lets say this cube house is made of nothing but mineral insulation 100mm thick, with internal dimensions: 7m wide, 7m long and 7m high.

Our cube house is situated in a climate with no wind or solar gain just a stable 12C outside air temperature year round.

How much energy would it take to keep this hypothetical house at a stable 21C?

As we heat the house, heat will flow from the hotter internal air through the walls to the colder external air via conduction and so the equation that we need is the fundamental physics equation for heat conduction.

H = (kA / l) x (Tinternal – Texternal)

See the great hyperphysics site for more on the heat conduction equation and everything else physics.

The Wikipedia table on material thermal conductivity tells us that mineral insulation has a thermal conductivity of 0.04 W/mK. We can take the area of the material to be the internal area of our cube house (imagine folding the cube house out so that we just have this one dimensional wall of area A and thickness l), there is of course a difference between the internal area and the external area of our cube house but lets come back to that one later and take the internal area for now which is:

7m x 7m x 6 surfaces = 294 m2

Putting the numbers into the heat conductivity equation we get:

H = (0.04 x 294 / 0.1) x (21 – 12) = 1529 Watts

And so we find we would need a fairly standard 1.5kW heater to keep our cube house at 21C.
1529W continuously would work out to being 37 kWh per day and 13392 kWh/year.

Heat loss through building elements is one of the main cornerstones of a building energy model. But in models such as SAP its not usually referred to as the heat conductivity equation nor is the thermal conductivity of a material the usual starting point. Instead models like SAP start with a building elements U-value and an equation that looks like this:

Heat loss = U-value x Area x Temperature Difference

For an element made of a single uniform material the U-value is simply the materials thermal conductivity k divided by its thickness. But building elements are only sometimes single uniform materials, a building element can also be an assembly of different materials such as a timber stud wall with insulation, membranes and air inside. The physical process of heat transfer through the element may also be a mixture of conductive, convective and radiative heat transfer.

Coming from a physics background I found it useful to start with what I was familiar with and I think its useful to understand that in the case where a material is uniform the heat loss through a building element equation is the same as the basic equation for heat conductivity and the U-value is just the k/l part lumped together into one constant.

The U-value of our 100mm mineral insulation wall would therefore be: U-value = k / l = 0.04 / 0.1 = 0.4  W/m2.K.

If you have a composite of materials, say a layer of wood and then a layer of insulation its possible to calculate the overall U-value in the same way as we calculate the equivalent resistance of parallel resistors in electronics.

In the next post I will go through an example of a slightly more complicated but still very simple house model made up a series of different elements with different U-values.

For further reading on U-values see U-values definition and calculation by the RIBA.

Building Energy Modelling part 3 - Carbon Coop and Open Source SAP 2012

Continuing from the last post on building energy modelling. Fast forward to late 2012 when I met Matt Fawcett of Carbon Coop and heard at length about all the exciting work they are doing around retrofit, see the blog here: http://openenergymonitor.blogspot.co.uk/2013/05/carbon-coop.html

As I mentioned in the post Carbon coop and their technical partners URBED have put a lot of work into an assessment method for assessing a households suitability for retrofit work, working out a list of measures including full details and costings, how a household can achieve 60-80% carbon reduction. Their assessment method is based on SAP 2012 and was implemented by Charlie Baker of URBED in a Mac Numbers spreadsheet.


Matt explained that to take things further they wanted to integrate the monitoring with the assessments in order to be able to reduce assumptions used and that they thought that longer term an open source online version of the retrofit assessment method would be key to make retrofit more accessible and open for a greater number of people.

At home I also wanted to move forward with this idea of being able to use monitoring combined with a building energy model to understand the current building fabric performance at home and the lab and get a better understanding of what the effect would be of adding insulation and draught proofing.

And so Matt and I started the process of converting the SAP 2012 pdf worksheet specification into a open source javascript web application which as a first draft is now about 90% complete, its implemented as an emoncms module so that as it develops we could easily pull in monitored data sets such as the actual average monthly internal temperature in the building, actual electricity consumption for internal gains and so on. 


The module source code can be found on github here: github.com/emoncms/sap

Try it out on emoncms.org here: http://emoncms.org/sap (no need to login)

Most of the calculations can be found in the javascript file equations.js and associated functions in solar.js, windowgains.js and utilisationfactor.js. The interface pages can be found in the folder named compiled (which isn't a particularly good name any more, a remnant from earlier development). The file sap_view.php is what ties it all together loading the equations.js and the relevant page interface.

Having got this far with the implementation and understanding better the requirements, what calculations are needed etc, its becoming clearer that the current implementation really needs a round of re-factoring to make it easier to develop with going forward.

The SAP model lends it self well to be broken down into a series of sub-modules, so rather than have all calculations in one file, the various parts of the calculation and related interfaces are broken out into separate modules with clear inputs and outputs and the possibility of being able to interchange these sub-modules, you could decide to use the SAP internal temperature estimation sheet/model or bring that in from monitored data for example.

So that's pretty much the state of development on this at the moment. The recent meetup with Houseahedron couldn't really have come with better timing as Matt and I had just been chatting about where this could lead in the future and what would be really cool to have, we where saying how nice it would be if the building thermal data could be visualised in 3D but thought that would be something a long way down the line, it was literally a couple of week later that the Houseahedron team got in contact saying they where going to be developing just this and all open source. With a larger team of us, with different skill-sets working on this, I think this could turn out to be a really useful tool that integrates well with monitoring to allows us to better quantify the performance of buildings and the effect of implementing various measures, exciting stuff!

Fridge Defrosting

Update 27/06/13:

As kindly pointed out by Jörg Becker in the comments below I mad an error with the timebase. I had assumed If I zoomed in the same amount that the time base would be the same, I had not realised that this was not actually the case. Below is an updated screen grab with the correct time period. As we can see the power in the window is pretty much the same 0.28/0.29Kwh. Defrosting the fridge does not seem to have had much of a reduction effect in the power consumption, just an increased duty cycle. Apologies for my original misleading post below. 

Thanks again to Jörg Becker for pointing this out. 


Yesterday I defrosted my fridge, I was amazed at the effect it had on it's energy consumption and pattern.


Energy consumption due to fridge dropped from 2.29 Kwh/d to 1.09Kwh/d, about a 50% readuction. The pattern of energy consumption changed a fair bit, now defrosted the fridge switches on for a much shorter period of time,  obviously getting up to down to temperature much quicker.

If I keep the fridge defrosted regularly all year it should save me around £60 a year.

I am aware that my fridge is quite an old model and a new model would use less energy overall and not require defrosting. Something to thing about for the future..

Building Energy Modelling part 2 - First attempts and research


It was not long after reading the Whole House Book that Glyn and I went to a green hackathon in London (January 2012) and I spent my time creating a small web app that implemented a really basic model that produced estimates of 20 year savings of implementing various building fabric improvement measures, its still up here:


Source code: https://github.com/openenergymonitor/retrofit.git

I had not quite realised the importance of solar and internal gains at that point or indeed utilisation factors and heating patterns so the green hackathon retrofit calculator will only be remotely close to actual heating demand in very leaky buildings, with few windows and consistently heated to an even set temperature all year. Paul Tanner pointed out the heating pattern flaw at the time in a tweet but it wasnt until more recently that I got how significant the difference is.

After the green hackathon retrofit calculator I tried to develop the idea of a calculator that would output a list of proposed measures, their energy savings and financial payback but had low confidence in the accuracy of its output so decided to shelve it for a while.

At around the same time I did a little work on dynamic simulation of heat conduction through a wall that can be found here: http://vis.openenergymonitor.org/dev/heatflow01/ but was also unsure of its accuracy, needing to brush up on my calculus to check precisely by computing an exact solution via the fourier method.

I had by now read through the SAP worksheet (The UK's standard assessment procedure for assessing the energy performance of domestic buildings) many times but thought it a little too long to embark on implementing it, although basing an energy model on a standard approach supported widely seemed like the best approach.

Searching for open source SAP implementations I found a useful open source version of the 2009 SAP worksheet implemented as a open office spreadsheet by Wookey here: http://wookware.org/files/SAPWorksheet9.80.ods which if you prefer spreadsheets to code is certainly worth looking at. There was also a thread on the greenbuildingforums calling for good open source building energy modelling software with a lively debate: http://www.greenbuildingforum.co.uk/newforum/comments.php?DiscussionID=6574&page=1#Item_0

In my searching I also came across a fully dynamic open source building energy model called esp-r developed by the University of Strathclyde http://www.esru.strath.ac.uk/Programs/ESP-r.htm and created a page on how to install it on ubuntu on the openenergymonitor site which I never linked in here: http://openenergymonitor.org/emon/node/1715.

I'm also more recently aware that there is another open source dynamic building energy modelling project called OpenStudio which looks like it has a nice front end, OpenStudio is a National Renewable Energy Laboratories project https://openstudio.nrel.gov/ and has sketchup integrations, looks nice!

Next blog post: Carbon Coop and the open source SAP 2012

Building Energy Modelling part 1 - The Whole House Book

In the blog post what kind of information can we extract from power measurements I concluded that I needed a simple model of my electricity use in addition to the monitored data in order to ultimately get to a list of actions that I need to do to optimise my electricity use.

The other conclusion was that to significantly reduce electricity consumption further I would need to change the heating system and to take a whole house view: improve the building fabric performance by increasing insulation levels, reducing draughts and improving solar gain in order to reduce heating demand in the first place.

For a while now I have had a growing interest in looking at heating energy consumption and how to reduce heating energy demand through building fabric improvements in addition to electricity consumption.

In the energy study of local households that we did in 2011-2012 heating energy came out as the largest energy user, we recorded details about house construction, levels of insulation, perceived comfort, temperature, draught levels, amount of glazing etc but didn't have the tools or knowledge to be able to give any sort of tailored advice, relate general statements that we're all familiar with like insulation can reduce energy demand by x% to a particular households situation, it wasn't in the remit of the project but we could see that that was what was needed next.

At home it was also clear that heating was the largest user of energy and the area with the most potential to achieve significant energy savings and carbon reduction especially as electricity use is already optimised as far as possible.

I started to read up on low energy building design to get a better understanding of the subject. I had an Aha moment when I read chapter 7 of The Whole House Book by Pat Borer & Cindy Harris which outlines a really simple building energy model:


The model starts by calculating how many Watts are lost through the building fabric per degree Kelvin (same for Celsius) temperature difference between the inside and outside temperature. This is calculated by multiplying the area of the various building elements such as walls, windows, roof and floor by their U-values. The model also takes into account the amount of heat lost via draughts (infiltration). The model then uses the concept of degree-days to calculate the annual heating demand.

Before reading this I had thought that to get any sort of useful estimated output on effect of adding insulation to a building a full dynamic simulation would be needed. But this simple model showed that you can get some surprisingly informative estimates from some quite straightforward calculations.

For the rest of the book Pat Borer & Cindy Harris use a more detailed calculation that also takes into account solar gains, internal (casual) gains and water heating requirements. If your looking for a good book on low energy building design, self-build and energy calculations Id really recommend this book.

Carbon Coop and Houseahedron meetup


Just got back from a couple of days visiting the Carbon Coop team in Manchester and Houseahedron in Liverpool.

On tuesday/wednesday Matt and I spent some time working on the open source SAP calculator, improving the domestic hot water section, fixing a bug where if the solar hot water section was not complete the calculations would break and another bug that kept causing us to loose data after having completed one of the most tedious data entry parts: putting in all the heat loss elements. A check was added to the server side code to ensure that the json string containing the sap data was not corrupted by a broken transmission or whatever that was causing the string to get corrupted.

try it out: emoncms.org/sap

We spent time entering several SAP calculations that had already been done in a Mac Numbers spreadsheet implementation of SAP developed by Charlie Baker of URBED to check that results agree, the results don't quite agree yet as there are a couple sections in this new open source SAP implementation that are not fully complete but we're almost there.

The EcoHome_Lab event was on the Wednesday evening and James Pul, Julian Todd and John Donovan of Houseahedron came over from Liverpool and gave a demo of their work.


What they are working on is really impressive and it ties in really well with recent openenergymonitor developments such as the open source SAP model and the idea that quite a few people have been talking about of integrating temperature and energy sensing into a building energy model in order to cross check and reduce the number of assumptions needed.

What the houseahedron guys are working on would really take this idea to another level, going beyond the 1D steady state modelling that is the SAP model, implementing a fully 3D dynamic model of heat flow in a building and then visualising it with rich 3D webgl graphics.

They want it to be possible to walk through a house and explore wall temperatures on a tablet in realtime with data coming from multiple temperature sensors placed all over the house and then be able to explore what it would look like if you added say 100mm of insulation to the walls.

One of the best bits is the way they are creating the 3d model of the house using a laser scanner! which generates a point cloud from which they generate the model. The point cloud is used as a sketch on which to draw the model manually at the moment as its too difficulty a problem to generate the 3d model completely automatically but its a pretty incredible way of getting all the dimensions you need to build a 3d model of a house and it only takes 6-7 minutes. Here's a screenshot of an example point cloud of an office building they scanned:


The best bit is that they are planning on releasing all the software for this as open source under GPL, its all written in python + flask, javascript and webGL and they are keen to use openenergymonitor hardware for the sensing.

Here's their twitter and website:

Getting the Air Quality Egg to work with the OpenEnergyMonitor system and emoncms


I spent a bit of time today putting a sketch together to get the AirQuality Egg Shield and Air Quality Egg Remote node to work as a standard sensor node with the OpenEnergyMonitor system, so that I could log data into emoncms to visualise changes over time and use the existing raspberrypi + rfm12pi base station setup thats already receiving data from an emontx and low power temperature nodes.

I placed the shield on top of a NanodeRF as it has the RFM12 RF module but Im not actually using the Ethernet part, Im just using the nanode as an arduino with an RFM12 module to form a remote sensor node. This is the same setup as is found inside the Air Quality Egg Remote node.


The sketch is adapted from the PollEggBus_EPA sketch developed by Wicked Device who develop and make the Air Quality Egg and just puts the NO2, CO, temperature and humidity data in the standard data structure of a series of integer values that the emontx and other nodes use.

Download the sketch here to try it out:

I've now been logging for about 3 hours and there's already some interesting data to look at, I got back from being out on my bike and had a shower at 20:50 you can see the RH shoot up, there also seems to be a spike in NO2 and a dip in CO not sure what that means, any ideas?


Check out the live dashboard here:

Air quality is not something I know much about but after discussing it with the Carbon Coop guys recently it sounds like a fascinating and important area to understand, Matt from Carbon Coop explained that high levels of CO2 (not monitored on the AQE shield above but something that would be great to add - but more expensive) in buildings create problems around drowsiness and ability to concentrate and so monitoring these things could be important when designing and making sure a building after having undergone retrofit work has healthy air. It would also be interesting to understand in greater detail the longer term health implications of air quality and the aspects of this that we can measure. There certainly seems to be a lot of resources on this on the Air Quality Egg wiki here which should make interesting reading: http://airqualityegg.wikispaces.com/AirQualityEgg

What kind of information can we extract from power measurements?


The most direct representation of power data is power over time which is what we get if we simply log the power values transmitted from a monitor. With this we can see what our power consumption or power generation looks like throughout a day, you can see the relative magnitude of different loads, identify visually different appliances from kettle's to LED light bulbs.

The power vs time visualisation can be found under the Vis tab in emoncms by selecting the rawdata visualisation.
Its a useful visual tool and with a little extra stats overlayed on the graph such as how many kwh are contained in the window being viewed and the average power you can start to do things like calculate roughly how much energy individual appliances use such as a fridge or a particular evenings immersion heater use.

Beyond the basic power vs time graph we can gain more information by processing the incoming power data into kwh per day data. kwh per day data can be calculated as either the average power in watts for a day x 0.024 or the sum of the time spent at different powers divided by the energy in 1 kwh. A graph of kwh per day vs time makes it easy to compare one day against another and see trends over months or years.
The daily visualisation can be found under the Vis tab in emoncms by selecting the bargraph visualisation.
That's pretty good but we can extract more information from the power data if we process the power data to record the energy used at different power levels in a particular day, how much energy is used at 100W, 200W or 3000W. This is what the histogram input processor does in emoncms. The following graph shows the result of recording energy used at different power levels with a 25W resolution over 7 months from my own house. The spike at 2.5kW is an electric heater which we used a lot throughout the winter, the 3.5kW spike is the immersion heater and 0-500W is lights, laptops, hifi etc.

Note: The histogram visualisation can be found under the Vis tab by selecting histgraph. The default histogram has smaller resolution bars at higher power levels, i need to add an option for higher detailed histogram data calculation in the input process model to make this easier to achieve. To produce the graph above I actual converted the power data feed to histogram data using a conversion module that can be found here. The code that produces the histogram as data is coming in can be found on lines 543 to 608 in the process_model.php.
The histogram data can also be visualised within the kwh per day type graph so that we can see how a particular days energy consumption breaks down into energy used at less than say 1kw, energy used between 1 and 3 kW and 3kW up but then also easily compare one day to the next:

From the emoncms report module.
For me, what I want to get out of monitoring my electricity consumption is to first understand how I use electricity and then work out what definite actions I can take to reduce any my electricity consumption and then be able to confirm that those actions did indeed produce the expected result. After all optimisations are done, Id like the monitor and reporting tools to help keep me informed that I am maintaining an optimum electricity use level overtime, that it does not creep up again.

To answer these questions directly I found I needed one other thing that goes hand in hand with the monitoring and visualisations above, I needed a rough model of my electricity consumption that breaks electricity consumption down on a per appliance basis. Any actions that we take are on an per appliance basis and so we really need a per appliance level of specificity.  In the absence of per appliance monitoring or working applianceinference which would be the ultimate solution, this can be done with a simple model where a list of all the appliances in a house is entered manually including how many watts they use (which the energy monitor can be used to find out) and roughly how many hours per day they are used. This produces an estimate for how much electricity is used in a day, what the baseload should be and how much energy is consumed at different powers which can then be cross checked with the actual monitored data, the model can then be adjusted until the values align.

The reporting module in emoncms bring all this together on one page, the screen below shows the monitored data and model for the openenergymonitor lab and the small cottage next door:

You can find the reporting module in emoncms.org by clicking on Extras and then report. For local installations install the report module from github here
To align the model to the monitored data its a matter of aligning the model pie chart to the monitored data pie chart. In our case electricity consumption is highly variable day to day, month to month so the model can only apply to either the average of the days in the selected view or a single particular day, its informative to adjust the model for different times of the year. Once the model aligns well, its then possible to experiment with changing the appliances in the model and how many hours they are used for to see what effect that might have on total daily consumption.

The conclusion of our electricity consumption investigation is that we could save 5-10% by changing all CFL's to LED's and turning standby items off at the plug (especially the hifi and soldering iron station), continuing to optimise kettle use and immersion heater is also super important as leaving a 2800W kettle on for an extra minute uses as much as a 6W LED left on for 7-8 hours and so can easily remove any savings achieved by turning lights off. 

To significantly reduce electricity consumption further we would need to change the heating system and to take a whole house view: improve the building fabric performance by increasing insulation levels, reducing draughts and improving solar gain in order to reduce heating demand in the first place which is where recent work on temperature sensing, building energy modelling, the SAP calculator comes in but I will come back to that in further blog posts.

It would be nice to add additional tabs to the report module so that current and projected consumption levels can be easily compared, Id also like to add a feature to send a regular report email that keeps me updated on my week to week electricity consumption so that I can get at a glance information that minimises the effort I need to go to to see how I'm doing.