Emoncms.org load stats
You might be wondering what kind of load is on emoncms.org, maybe you have experienced it slow down from time to time and then other times be much faster, maybe your just intrigued about how much its used and what are the challenges with hosting a site like this. So what better way to investigate the load on emoncms.org that use the visualisation features built into emoncms itself.
This first graph is of server load since late January 2013 as recorded by the command 'uptime'. You can see a clear drop in load on the 16th of March where the re-factored emoncms v5 was introduced with its reduction in mysql queries in input processing:
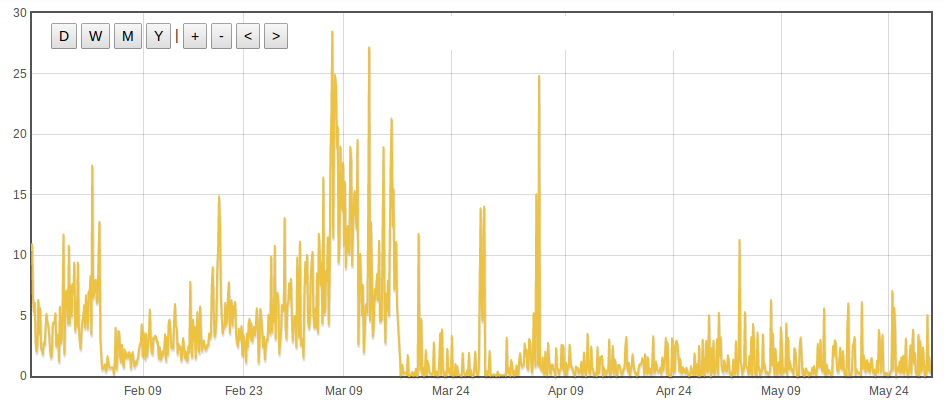
On a shorter time scale the load fluctuates at what seems to be periodic intervals with a significant spike every 10-12 minutes, a load of 3 is enough to make emoncms feel slightly sluggish on feed data requests.

The number of active feeds has grown from around 1350 to 2100 (750) since early March 2013, just over 300 new active feeds a month. The total number of feeds created in all time is 15660 a portion of these will have been deleted and replaced with new feeds, a portion will just be inactive.


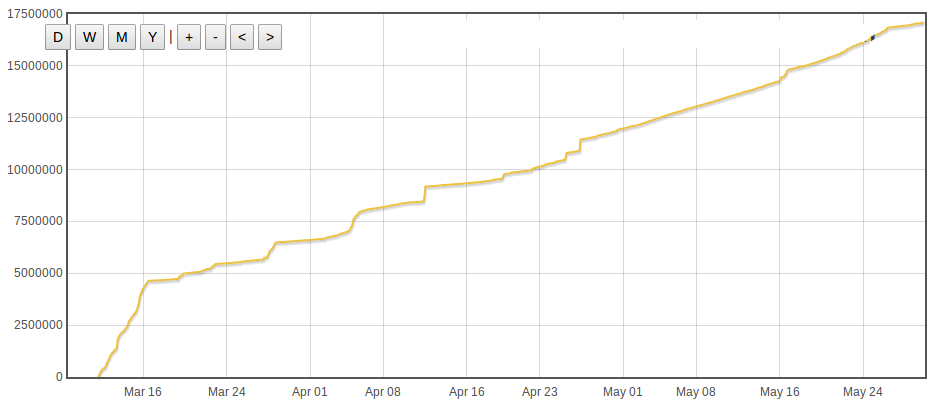
The next graph is the last server load related graph, it shows the time in seconds taken by the server to serve all requests, you can see again the time saved by the emoncms v5 implementation of input processing (the change of gradient on the 16th of March). High load events are also clearly visible as steps, some of these events made emoncms.org unresponsive for quite sometime, one of the larger high load events lasted 40 mins.
Emoncms.org disk use
Apart from load spikes, disk use is probably the most pressing concern with emoncms.org and probably emoncms in general. Disk use is growing pretty fast rising from 22GB at the start of February to 47GB now at the end of May. The vast majority of this is realtime feed data. I need to measure for certain but I think all the other tables including daily averages and histogram data come to only a few hundred MB.
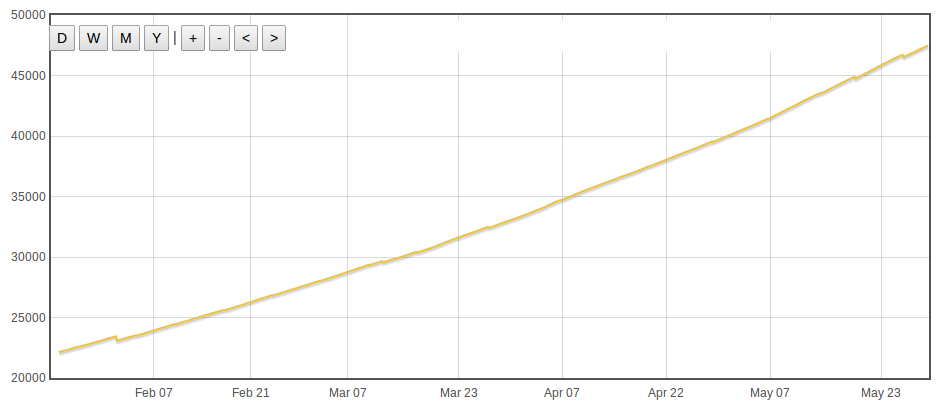
Disk use is rising at about 280 Mb a day so about 100 GB a year, disk space is charged for on a monthly basis (£2 per month for 10GB http://www.bigv.io/prices). For every 100GB stored the annual cost would therefore be £240 per 100GB per year without backup and £480 a year with second bigv server used for backup, so even if the number of feeds that are posting to emoncms.org stay constant and there are no new users, disk use costs for existing users will continue to rise if historic data is retained in its current form.
Luckily there are several potential solutions to this which I will come back to in another blog post, the most promising one being a method of compressing the data without loosing the vital time resolution on feed events. Essentially removing redundant datapoints, only preserving datapoints where changes are happening. This should be a beneficial feature for raspberry pi installations of emoncms as well where disk space is also at a premium.
So to summarise, I think there are two design challenges identified above that would be good to tackle going forward with emoncms:
- How to identify the source of and either distribute or limit the effect of whatever is causing load spikes.
- How to fix the disk space use problem.
While fixing these it would also be good to reduce query times and retain the vital resolution on feed events.
Apart from challenges the above graphs show the success of emoncms.org which is exciting, its great to see people use it, that's really encouraging. Lets keep rising the bar with what's possible with a fully open source cloud application energy monitoring service.
To engage in discussion regarding this post, please post on our Community Forum.