Blog
OpenEnergyMonitor

Reducing emoncms write load and a minimal python version of emoncms

Over the last few weeks I have been investigating how to reduce the write load of emoncms to explore if it might be possible to achieve long term logging on SD cards.

A brief summary

Through a mix of buffered writing of feed data to disk, reduction of the number of meta and average data files written to and use of the FAT filesystem, my home raspberrypi now has a write load of 0.4kb_wrtn/s down from 197kb_wrtn/s.. almost 500x less and the writes are all append only (there's no regular writing of the same part of a file again and again). The question is could this mean years of SD card logging rather than months?

Write buffering

A single Emoncms PHPFina (PHP Fixed Interval No averaging) or PHPTimeSeries datapoint uses between 4 and 9 bytes. The write load on the disk however is a bit more complicated than that. Most filesystems and disk's have a minimum IO size that is much larger than 4-9 bytes, on a FAT filesystem the minimum IO size is 512 bytes this means that if you try and write 4 bytes the operation will actually cause 512 bytes of write load. But its not just the datafile that gets written to, every file has inode meta data which can also result in a further 512 bytes of write load. A single 4 byte write can therefore cause 1kb of write load.

By buffering writes for as long as we can in memory and then writing in larger blocks its possible to reduce the write load significantly. The full investigation with a lot of benchmarking of different configurations including differences between FAT and Ext4 can be found here:

https://github.com/openenergymonitor/documentation/blob/master/BuildingBlocks/TimeSeries/writeloadinvestigation.md

A minimal version of emoncms in python

To make the investigation easier I simplified emoncms down to the core parts needed on a raspberrypi to get basic timeseries graphing: serial listener, node decoder, basic feed engine and a ui consisting of a nodelist and a single rawdata visualisation type and wrote the result in python making use of Jerome and Paul's (pb66) excellent work on the emonhub serial listener and node decoder.
Here's a diagram of the main components of the python app:


And some screenshots of what it looks like:

Node list:


Basic graphing:


The source code and an installation guide for this minimal python version of emoncms can be found here:

https://github.com/emoncms/development/tree/master/experimental/emon-py

Further development questions (copied from the end of the write load investigation page)

Is the reduced write load and longer SD card lifespan that might result from using the FAT filesystem worth the increased chance of data corruption from power failure that Ext4 might prevent?

It would be interesting to compare the performance of the FAT filesystem + 5 min application based commit time with the EXT4 filesystem with Journaling turned off and filesystem delayed allocation set to 5 min instead of write buffering in the application.


I posted on the EmonHub issues list about this last friday and I've been having a bit of a discussion there with Paul https://github.com/emonhub/emonhub/issues/48

I've also posted this on the forum's here:
http://openenergymonitor.org/emon/node/5387
emonGLCD V2 SMT Development

For sometime now the emonGLCD has been lagging behind other OpenEnergyMonitor hardware units in terms of development, we're still selling it only in thru-hole DIY kit form.

We've been thinking about updating it to SMT pre-assembled for some time, however we've been dragged our heels somewhat since there has been thoughts that maybe a smartphone app could fill the same function. However I believe a physical LCD display unit fulfils a slightly different role to a smartphone app. I believe in certain circumstances there is certainly value to having an always-on low power LCD display located in a prominent location displaying current power consumption and or generation.

I have found the emonGLCD with the ambient indication tri-colour LED's to be a really useful easy-to-read indication of solar PV import / export at any given time.

Doing a quick Google search shows that there are lots of emonGLCD being used and customized for all sorts of purposes we could not even have though of! For example: heat pump monitor, temperature measurements, electric car charge rate etc.

With this in mind, we have decided to make an SMT version of the emonGLCD keeping the design largely the same (same LCD panel size and same controller chip ST7565). This will mean the current emonGLCD firmware sketches should run on the new unit with little or no modifications.

I would be interested to heard your thoughts on what you would like in a new version of the emonGLCD?

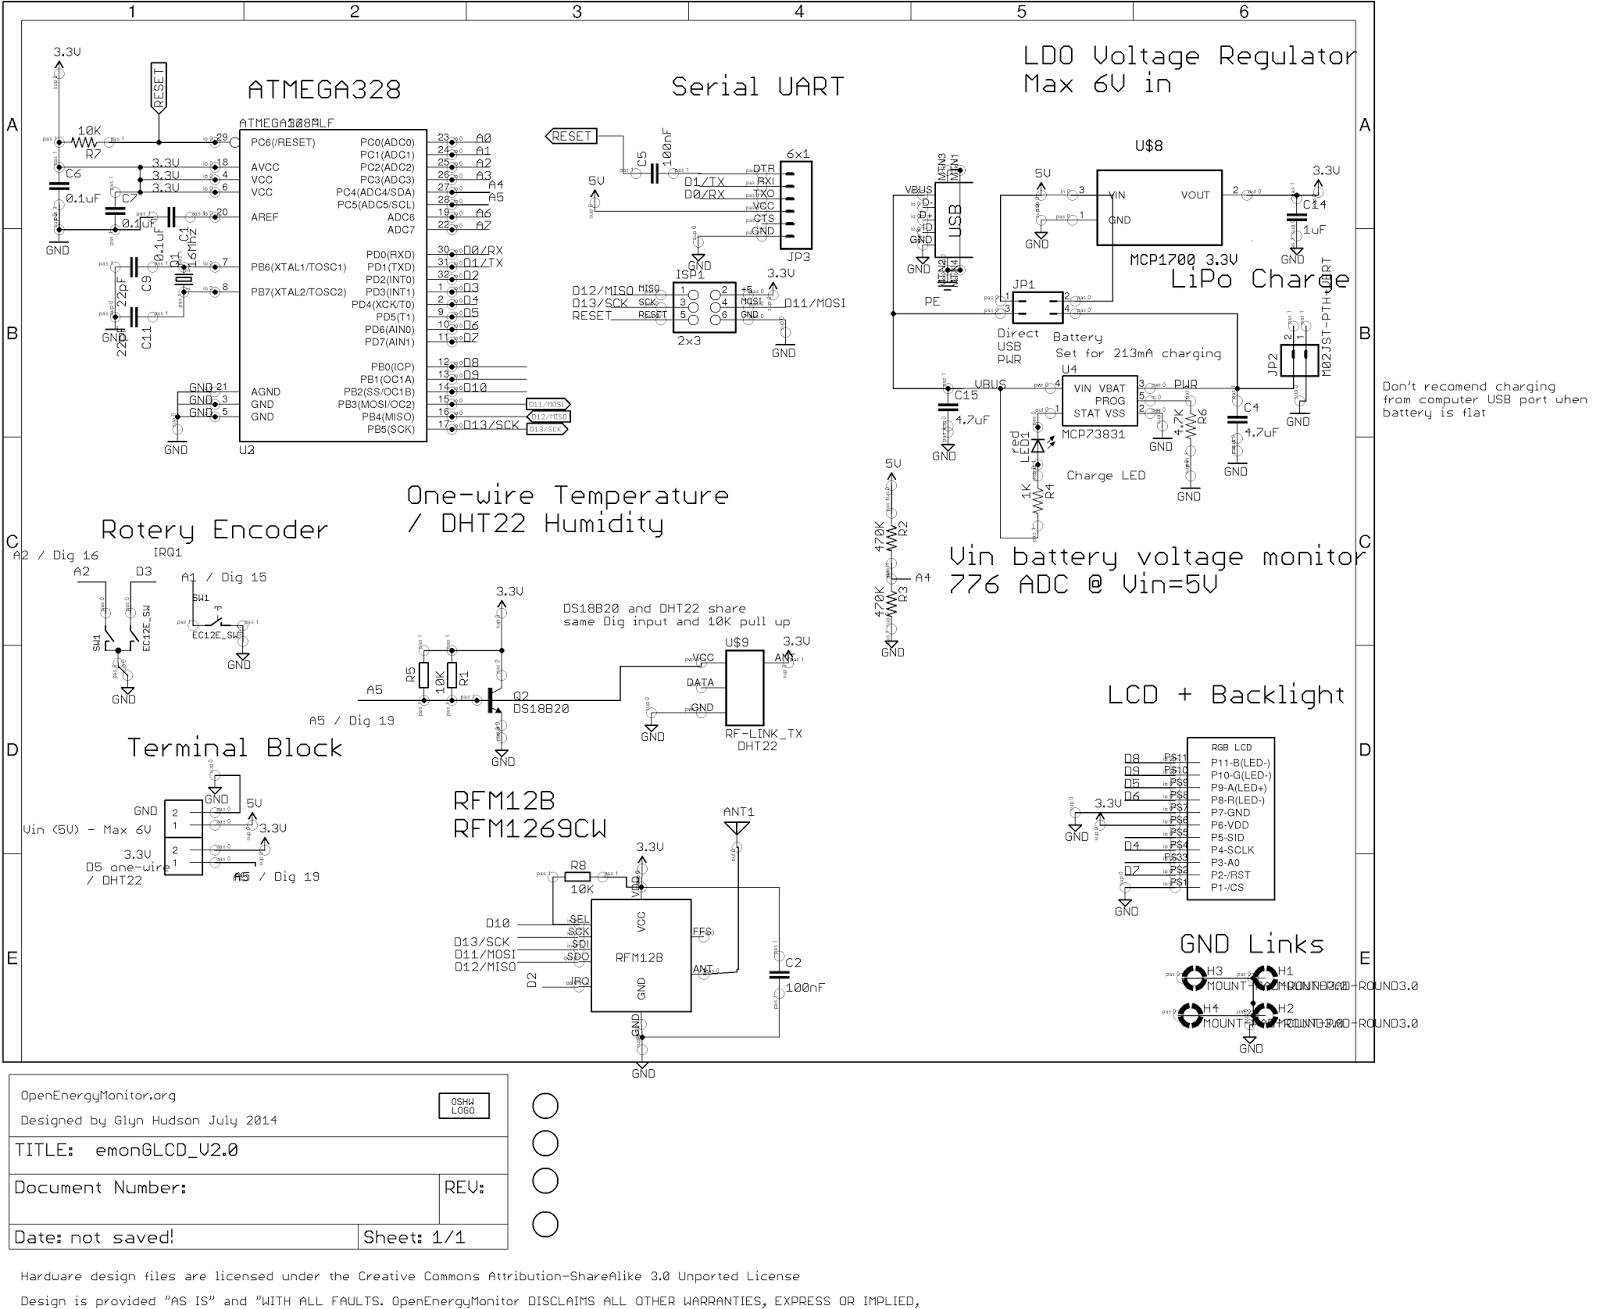
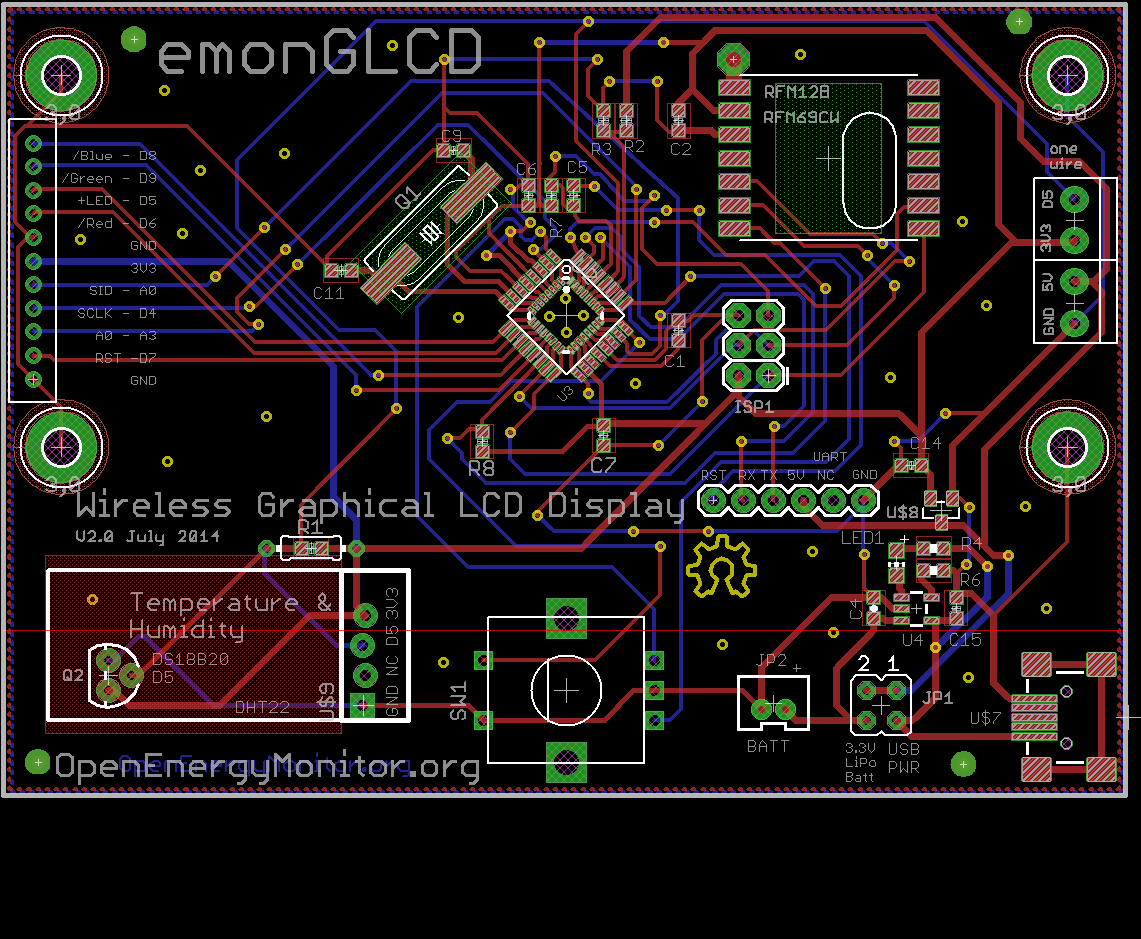
Over the past few weeks I've made a start to get a prototype, here is the main design criteria and features so far:
  • ST7565 128 x 64 LCD panel with integrated RGB backlight, specifically this Vatronix unit (to replace the LED's on the current version)
  • Single front facing rotary encoder with push-to-select (to replace the three push buttons the the current)
  • Option for lithium battery pack with USB battery charging circuit and battery voltage monitor
  • Arduino compatiable ATmega328 with RFM12B / RFM1269CW
  • Option for on-board DS18B20 and DHT22 temperature and humidity sensors 
Using SMT assembly and lower cost LCD unit and enclosure we should be able to reduce the price of the emonGLCD compared to the current version.

Yesterday I sent off for the first prototype PCB revision:


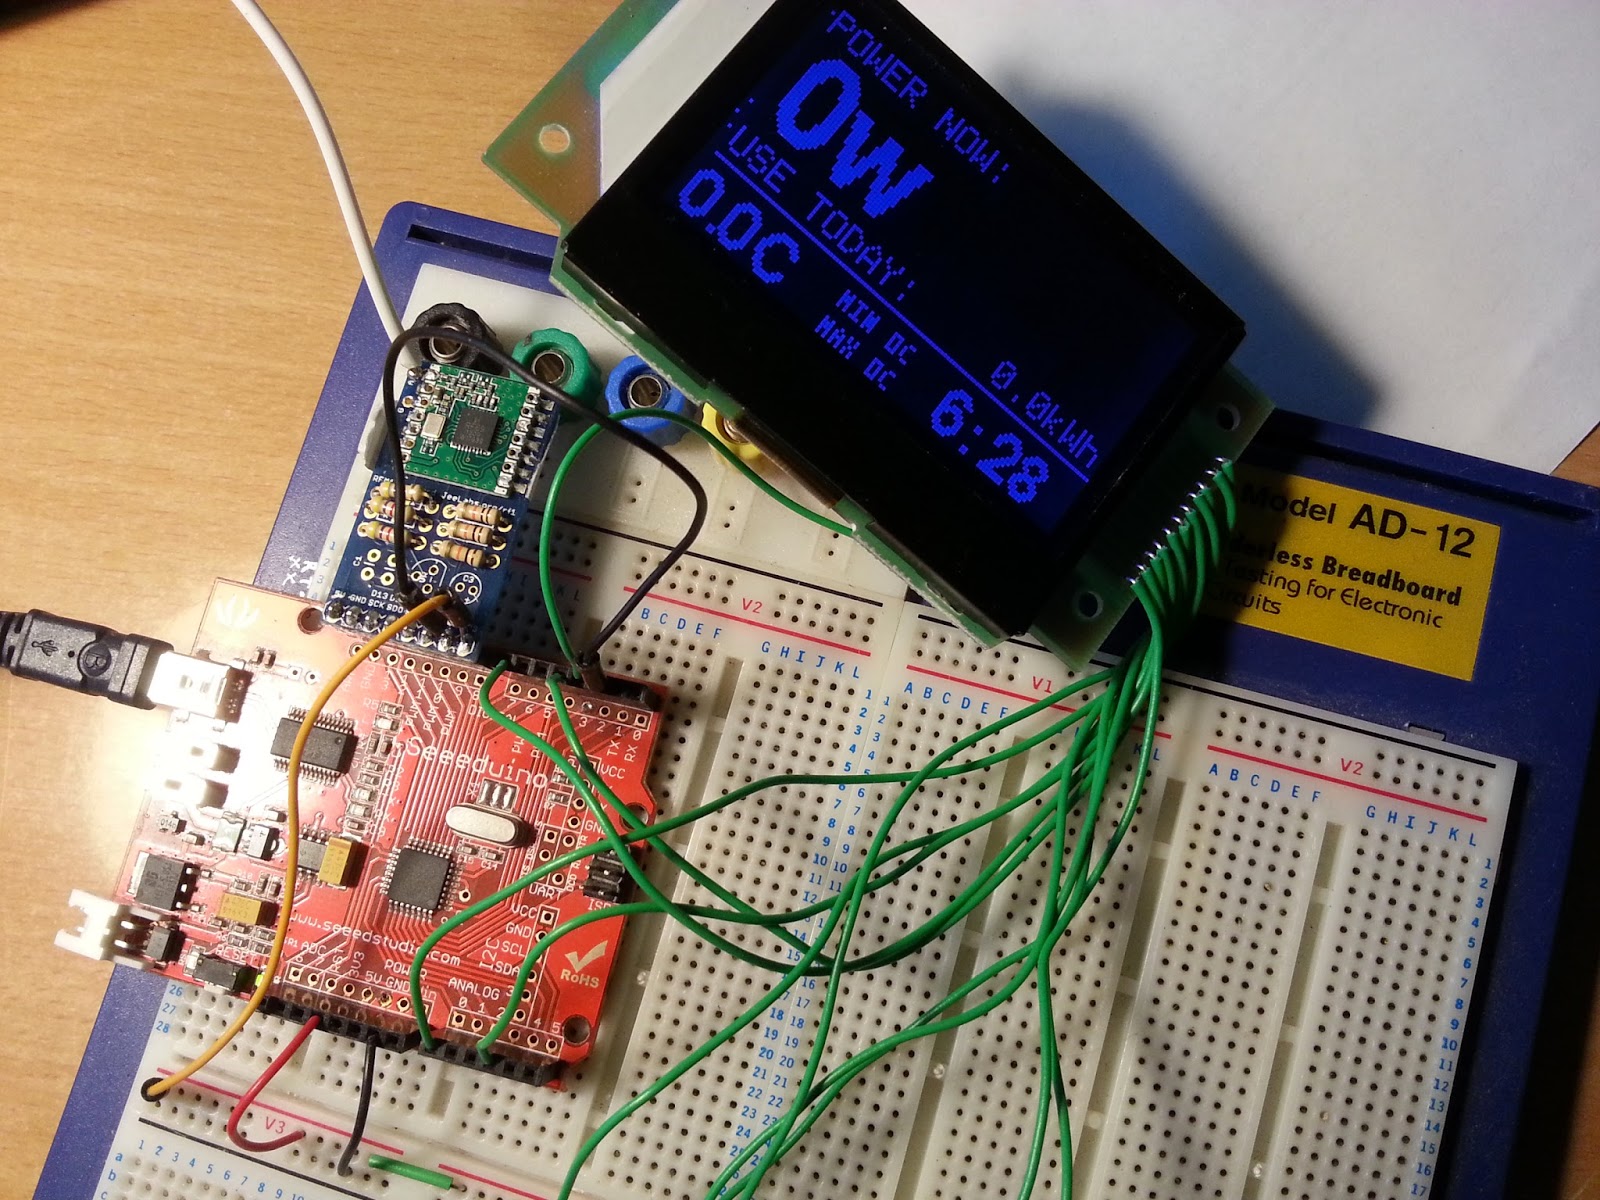
Testing the new LCD panel with built in RGB backlight
These images and more can be viewed in higher resolution in the emonGLCD V2 SMT Development album on G+, I will be periodically updating this album with development photos as things develop!
https://plus.google.com/photos/114424977493521882459/albums/6016575729643776881#

Enclosure 

The enclosure is an important part of the emonGLCD design considerations. We plan to move to a 'proper' custom made enclosure for the new emonGLCD. These are the main options available:

1.) 3D printed (for small volumes and prototyping, not really possible for 500+ per production run)
2.) layered laser cut plywood or acrylic (like the Pimoroni Raspberry Pi cases)
3.) Injection molded plastic

I'm specifically interested in exploring if/how an enclosure could be made with lowest embodied energy and maximum recyclability.
We have not yet made much progress on case design nor have we got a designer or manufacturer in mind. If you would like to work with us please get in touch. Equally if you have some ideas on enclosure design I look forward to hearing.

Please use the the emonGLCD V2 SMT forum thread for comments and discussion: http://openenergymonitor.org/emon/node/5374 


Emoncms time-series feed engine documentation

I've been working over the last few days on writing documentation on how the emoncms time-series feed engines work (phpfiwa, phpfina and phptimeseries). The documentation is an early draft at this stage and I would very much welcome comments.

https://github.com/openenergymonitor/documentation/tree/master/BuildingBlocks/TimeSeries

    Emoncms time series database development history
    Variable interval time series
    Fixed interval time series
    Fixed interval with averaging time series

On a related note out of an interest in creating a version of emoncms that will run and log to SD cards without wearing them out so fast I've started to look at how the write load created by the emoncms feed engines can be reduced through in memory buffering and writing in larger blocks to disk, initial testing suggests that it could be reduced by potentially more than a 1000x on systems with 30+ feeds, maybe several 100x on systems with only a few feeds.

See forum post: http://openenergymonitor.org/emon/node/5319

emonPi Raspberry Pi Energy Monitoring Shield - Prototype Dev Update

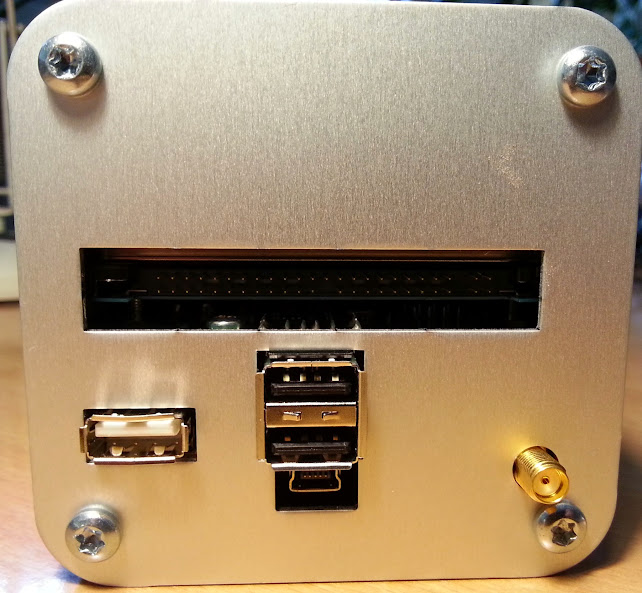
For a while now I have been working on developing a Raspberry Pi energy monitoring shield. Here is a preview of the first prototype design.

The emonPi is not designed to totally replace the emonTx V3, but rather to complement it. I see the emonPi fulfilling two applications:

1. As a low cost Raspberry Pi add-on shield to make all-in-one home energy monitoring unit based on the Raspberry Pi.  We will produce a version of the emonPi board on it's own (without enclosure, HDD and LCD), maybe even with just SMT components ready assembled (like the Arduino Lenoardo) to being the cost down further.

2. As a high quality, robust and nicely enclosed stand-alone energy monitoring unit and web-connected base station with LCD status display, built in hard-drive for local logging and backup. The emonPi has also been designed to be perfect for installers of heat-pump monitoring systems which require many temperature sensor wired up (see temperature sensing part of my forum post update) as well as power monitoring.

The emonPi has got an option for RFM12B / RFM69CW radio to enable it also to act as an emonBase, receiving date from other wireless nodes such as emonTH (room temperature and humidity node), emonTx V3 (energy monitoring node) and transmitting the current time to the emonGLCD LCD display.

Since the emonPi is an energy monitor sensing node and remote posting base station all-in-one and coupled with a status LCD this should make system setup, installation and debugging easier. The emonPi should also be great for remote administration since with the correct network config the Raspberry Pi can be accessed remotely, log files checked and even upload Arduino sketch firmware onto the emonPi's ATmega328.


Development has been documented in an ongoing open forum thread: http://openenergymonitor.org/emon/node/3937

My latest update post can be viewed here: http://openenergymonitor.org/emon/node/3937#comment-21865

emonPi - Raspberry Pi Energy Monitoring Shield Prototype 

emon Pi Features 

  • Two channel CT monitoring with AC sample input 
  • Ability to power the Raspberry Pi and an external HDD without the need for an additional USB hub, emonPi can also function without a HDD
  • RJ45 DS18B20 on-wire temperature bus to allow many temperature sensors to easily be added using a RJ45 breakout board for heatpump monitoring applications 
  • PWM and IRW I/O's on RJ45 
  • Status LCD
  • Compatible with RaspberryPi model A and model B 
  • Option for RFM12B / RFM69CW with SMA antenna to receive or transmit data from other sensor nodes
  • OOK (on-off keying) transmitter footprint for controlling remote plugs etc. 
  • ATmega328 with ability to remotely upload sketches vis Raspberry Pi Serial 
  • Open-source hardware, firmware and software 
  • High quality custom made, wall mountable enclosure
   

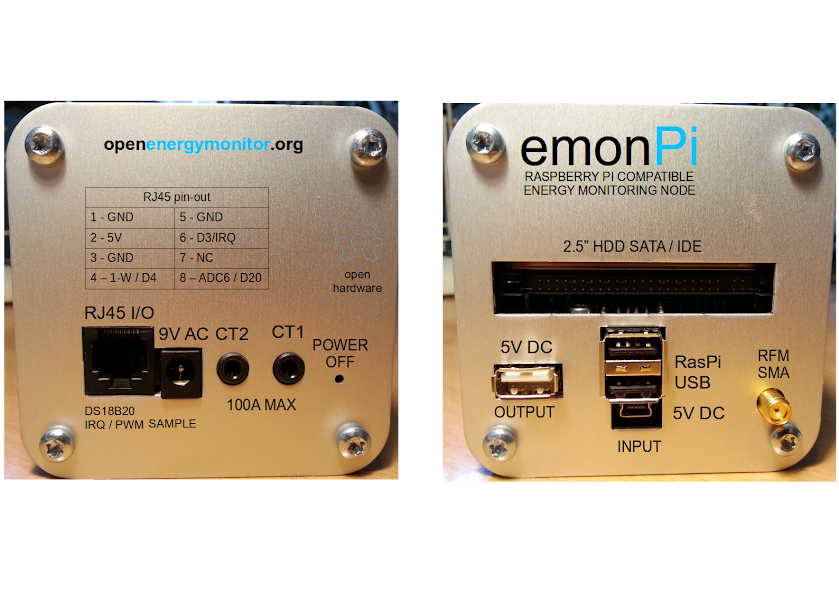
End-plate silkscreen draft:

See G+ album for more photos: https://plus.google.com/b/114424977493521882459/photos/+OpenenergymonitorOrgpage/albums/5999656723837107313

 LCD demo:


Please join in the emonPi's open-development forum thread if you have any ideas of thoughts to contribute:
http://openenergymonitor.org/emon/node/3937#comment-21865


The disadvantages of the emonPi compared to the current emonTx V3 are:

  • Only two CT channels, no (approximate) 3-phase
  • Due to higher power requirements of the Pi, the emonPi can't be powered from batteries, 5V DC USB mini-B is required. 
  • Again, due to higher power requirements of the Pi, the emonPi can't be powered from an AC-AC adapter, for real power a 5V DC and 9V AC adapter will both be required. 
  • Requires wifi connectivity or Ethernet to reach the location where the utility meter is located
  • Larger enclosure than the emonTx V3


    How to draw a myelectric style bar chart

    Part of the android app tutorial series: How to build an Energy Monitoring android App P1
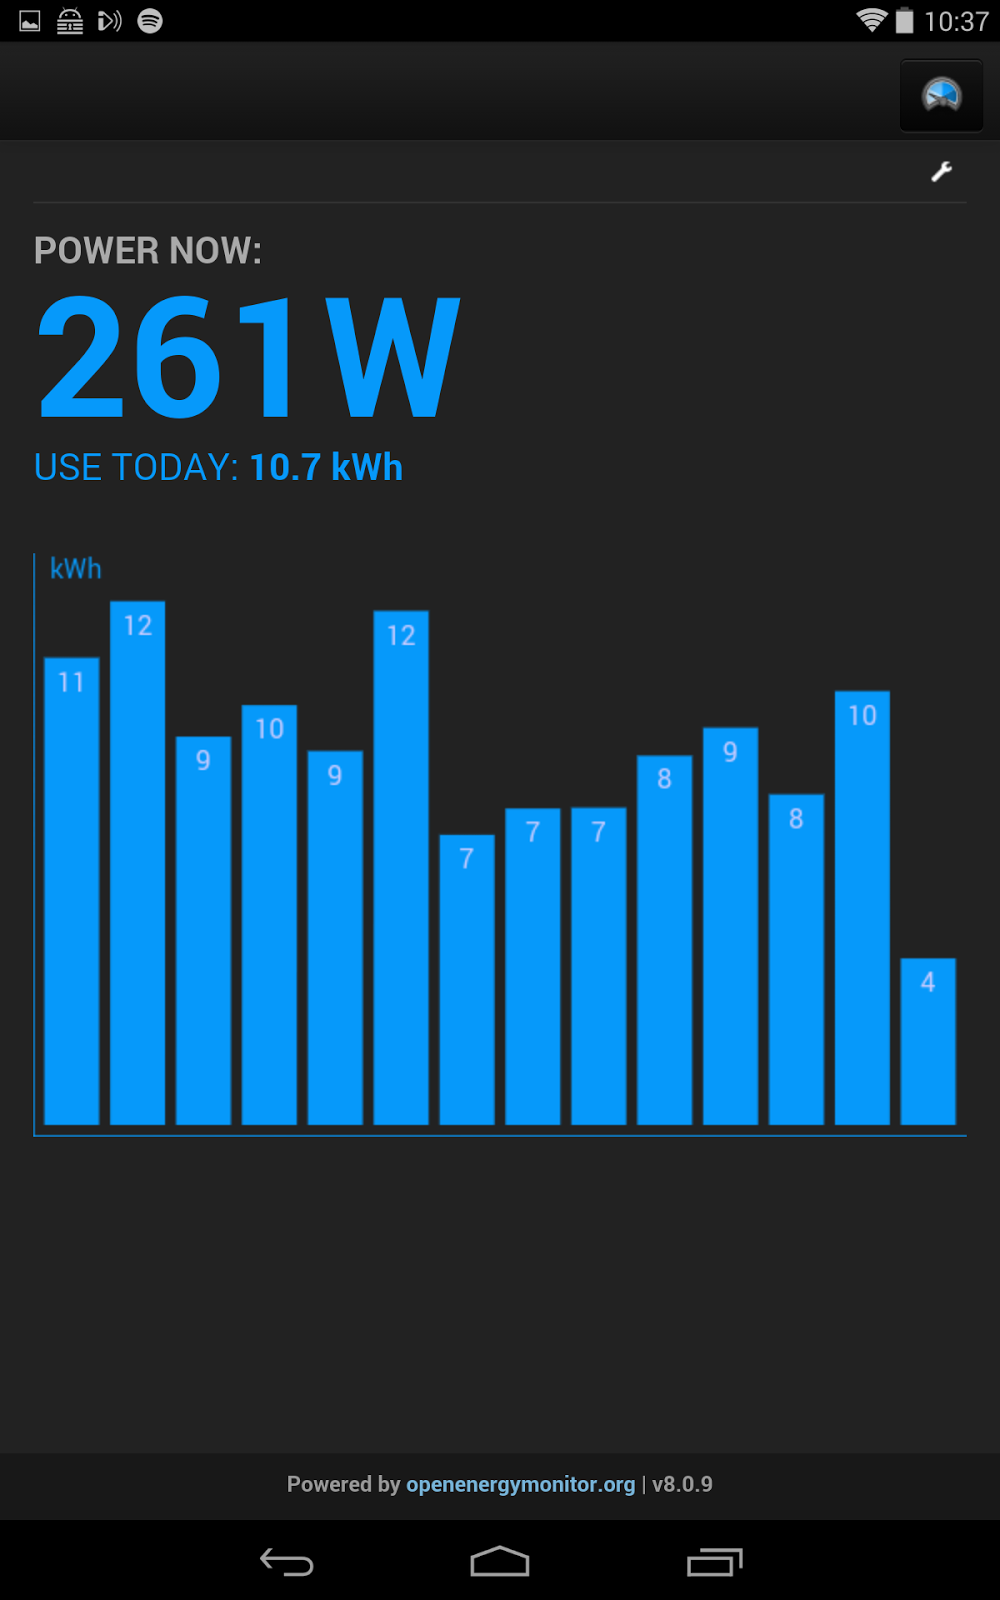
    Both the myelectric emoncms module and the soon to be myelectric android app have a bar chart that is written using the 2d graphics canvas. This short guide details how the bar chart is built and the first part is written to be applicable for different programming languages with examples in each particular language to come at the end, there's one for android java canvas at the moment.


    Writing custom graphs is not as complicated as I initially imagined it to be. Once you have a grasp of 2d graphics canvas sometimes its easier to write your own graph to get the style that you want. The myelectric graph was written from scratch in order to achieve a precise look: simple color scheme, bar height values overlayed on the bar, kWh label in the top-left corner.

    Tutorial: How to draw a myelectric style bar chart


    Gwynedd Council Award 2014

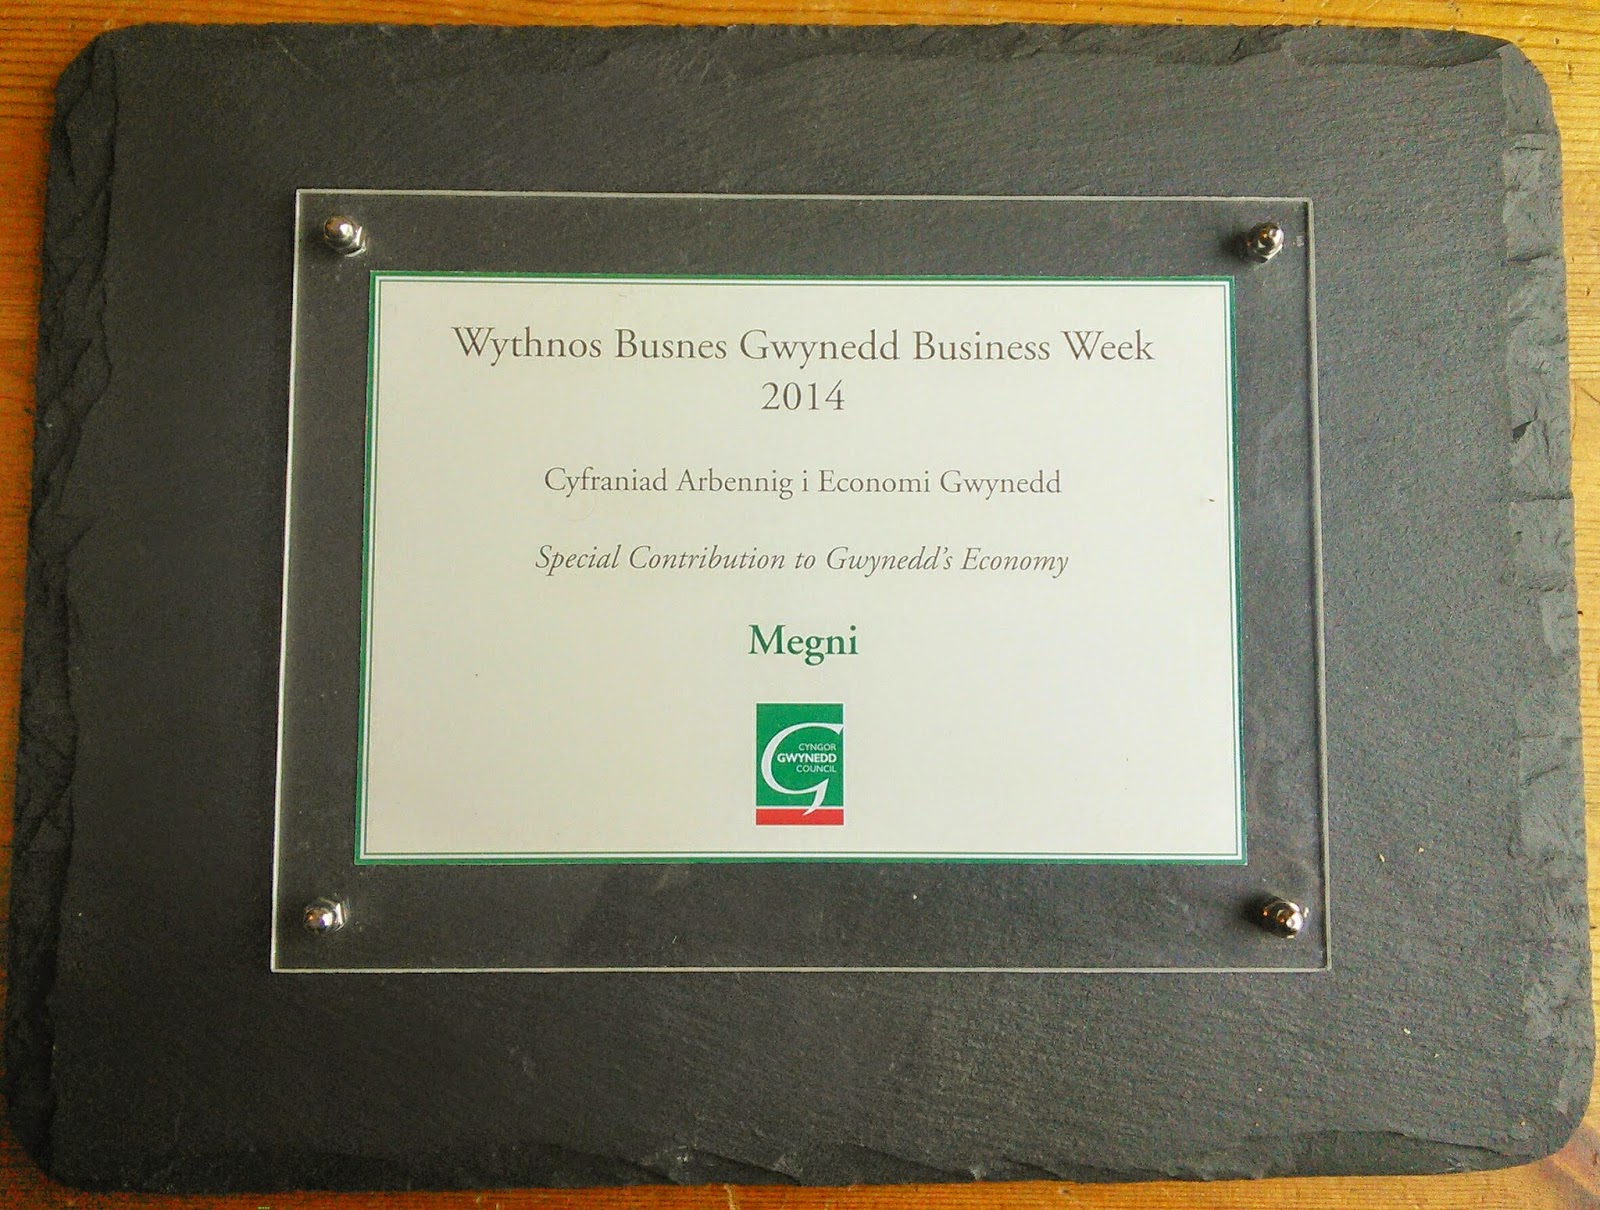
    Many thanks to Gwynedd Council (our local council) inviting us along to the Gwynedd Business Week dinner and presenting us the 'Special Contribution to Gwynedd's Economy' award week before last. 


    It's great to be recognised locally for our achievements, especially being an open-hardware business where everything we develop is open-source both hardware and software. It shows that there is a different way of doing things, technology business does not always need to be about closed IP, open-source works and open-source hardware businesses could be a way to have local employment not just here in North Wales but all over the world.

    Trystan stepping up to receive the award 

    A little side story about the slate plaque: We love the slate plaque, slate is very appropriate material to the area; North Wales was once the slate mining capital of the world. Nowadays the slate quarrys and mines are far fewer, many being dormant landmarks in the area used as recreation areas (e.g. our personal favourite, rock climbing :-D ). One underground cavern is used to house a 1.7MW pump storage hydro-electric power station which is the second largest in Europe  and 8th largest in the world

    View from the Llanberis Slate quarries - the round building is a vent hole for the 1.7MW pump-storage hydro power station underground...very cool!  

    Diolch yn fawr Cyngor Gwynedd! 


    How to build an Energy Monitoring android App part 1


    Glyn and I have wanted to have an android app to make it easier to access energy monitoring data from phone's and tablets for sometime.

    Last year we took part in a student project to develop an Emoncms android App with Mathew Keegan who was studying at the time at Aberystwyth University. Mathew made good progess on the foundations of the app which I've uploaded to github here: https://github.com/emoncms/androidAppDev/tree/master/MathewKeeganAberUni

    I've been trying to learn a bit of android app programming to understand what Mathew has developed. I followed a couple of Hello World tutorials and then explored networking and how to update the display. I've written up my notes as a tutorial: How to build an Energy Monitoring android App part 1 here:

    How to build an Energy Monitoring android App part 1


    Im going to try and continue development in this style by writing tutorials of how to do each step.

    I think we should all be able to build our own software (if we want to) and given the rising use of tablets and mobiles as our personal computing devices having at least a basic understanding of how to build an app is enlightening and satisfying to see the results on your phone. Even if you've only dabbled in software before I would like to encourage you to try the tutorial, please ask me if I can clarify anything and feel free to send me a github pull request with edits to the tutorial.

    My next tutorial will focus on how to use android graphics canvas to draw a graph that looks like the myelectric graph in the myelectric emoncms module.

    I've posted this blog post on the forum's here which is a better place to discuss:


    Emoncms Mobile View (My Electric)

    The latest version of Emoncms (V8) has got a feature called 'My Electric', this is a ready made mobile friendly dashboard.

    Just click the 'My Electric' button once logged into Emoncms and select your Power and KWh/d feeds. You will notice that that URL for this page automatically contains your API key, this is to enable this page to be bookmarked and easily accessed on a mobile device.

    If you use Chrome on both your desktop and mobile device your bookmarks will automatically sync. For even easier access Chrome on android allows web-pages to be pinned to the home screen for one button full screen access, this makes the Emoncms page load almost instantly, just like a native app giving a real-time dynamic view of how much power is currently being consumed or generated. Just follow the steps below:

    On first visit the My Electric page will ask you to select your Power and KWh/d feeds

    To create a shortcut on your android home screen hit the 'Add to home screen' button in Chrome

    A shortcut is now created on your homescreen to enable quickly firing up the dashboard

    When the homescreen short-cut is launched the My Electric dynamic mobile view page loads up almost instantly in Chrome in fullscreen mode (no URL bar etc.). This makes  it appear like a native app
    Recently Trystan has been working on taking the first steps to building a native android Emoncms app documenting the progress of building android apps as he goes along. If your an android developer who fancies working on this, please get in touch. See here for Trystans progress:

    https://github.com/openenergymonitor/documentation/blob/master/BuildingBlocks/androidApp/androidAppPart1.md 

    https://github.com/emoncms/androidAppDev/tree/master/HelloWorld

    Emoncms 'Hello World' android App


    Development update: EmonHub, Emoncms&MQTT, Application guides

    There's been a lot of development happening recently but not being blogged about so here's a short overview with links to where to find out more:

    EmonHub (The next version of the oem_gateway)
    http://openenergymonitor.org/emon/node/5203
    Paul (pb66), Jerome, Dave McCraw and I have been discussing the best way to integrate the ability to listen and dispatch data with different datatypes and how best to integrate threading so that dispatchers cant block the other dispatchers and listeners.


    Using MQTT with Emoncms to make a more extensible flexible system.
    We've discussed the idea of using MQTT within emoncms several times before but the idea came up again during discussion about the best way to implement node decoding in emonhub. Emoncms could provide some of the same features of emonhub ie multiple listeners and multiple dispatchers in an elegant way if it incorporated mqtt message queues. It would also provide benefits for control as initially explored here last December https://github.com/emoncms/development/tree/master/experimental/control/nodejs_websocket_thermostat

    Here's a system diagram of how it could look like:


    This approach needs a fair bit of work to make it a really nice solution, If you think this is the way to go it would be great to get some help with making it happen, in particular:
    • Integrating the event module by running it as its own process subscribed to the applicable mqtt topics.
    • Writing a process for the emonhub style dispatcher for sending data to other services such as a remote emoncms or another service entirely such as PVOutput or ThingSpeak
    • Creating raspberrypi module style emoncms gui for the new python based listener setting the rfm12pi radio settings.
    • Managing all these processes, a process status interface in emoncms?
    Richard Hatfield and I have also been doing work on setting up Emoncms + MQTT + scheduler for heating control, the raspberrypi software setup guide for the configuration so far is here:
    https://github.com/openenergymonitor/documentation/blob/master/Modules/RaspberryPI/FullStackHDDScheduler/FullStackHDDScheduler.md

    There are also some new related MQTT mini examples in the emoncms/development repository: https://github.com/emoncms/development

    I've created a forum thread for discussing emoncms + mqtt here:
    http://openenergymonitor.org/emon/node/5207

    New Application Guides


    An ongoing project for some time now is the writing of new application guides that go through step by step system building for home energy monitoring, heatpump monitoring, solar pv and thermal performance monitoring, integrating some of the new features for counting watt-hours on the emontx and using some of the new emoncms features such as myelectric. There's a new github repository in which to develop these guides. The table of content so far is:


    Help with testing and github pull requests with changes to these guides would be most appreciated and if youd like to submit a guide for an application or configuration that you dont think has been covered well that would also be welcome. Please get in touch on the forums if you've got any question's about development and how to get involved.