Blog
OpenEnergyMonitor

Research Project Call for Participants


In collaboration with Corina Sas from Lancaster University we would like to to evaluate members' experience of building, setting up and using our monitors and how these impact on people's understanding of energy consumption and household practices. The larger aim is to to explore how energy monitoring technologies could be better designed to support sustainable practices.

A team of researchers for Lancaster will run this study consisting of interviews lasting around 1 hrs. For this, a researcher will visit you in your home at your convenience, or if you live further away from Lancaster/Manchester, then Skype interviews can be arranged. As a thank you will be offer you an organic veg box.

The plan is to complete the study by end of the year. If you are interested and able to help, please contact the researcher with your available dates: Dr Corina Sas at [email protected]

Thanks a lot for your support.

Please post any questions to forum thread: http://openenergymonitor.org/emon/node/6156

Snowdonia household energy study, exploring zero carbon solutions

A couple of years ago Glyn and I and a friend of ours Bethan Gritten carried out an energy study with a local organisation called EcoBro of 17 households in Snowdonia, North Wales including our own.

We looked at the energy used by each household for electric, heating and transport and what the effect would be of applying the solutions outlined in both ZeroCarbonBritain and Sustainable energy without the hot air, visualising the result using David MacKay's energy stack graphics.

I've been looking again at this work recently as I find it a really useful and tangible way of looking at the energy problem and I've taken the opportunity to improve the energy stack graphic visualisation and put it up online here:

Dynamic visualisation:
http://egni.ecobro.org/data

The code for it is open source and on github here:
https://github.com/TrystanLea/energystacks

Here's a brief run through of what you can see:

Current Energy Use
This first graphic shows each households current energy use and where that energy is used:


24% of the energy used by the households come from renewable sources, whether biomass or 100% green electricity tariffs. The wide range of total energy use per household is quite interesting, using the dynamic tool you can explore the contribution of occupancy and floor area. You can also look at C02 and energy cost per household.

Solutions for reaching 100% sustainable energy for household electric, heating and transport.

In both the ZeroCarbonBritain report and David MacKay's Sustainable Energy without the hot air, building retrofit (insulation and air-tightness), heatpumps and electric vehicles form the cornerstone's of both significantly reducing the amount of energy we need to provide the same amount of comfort/utility and making it possible to power the remaining energy demand from electricity generated by sustainable energy.

The following graphics show's what the effect would be if each household in the study applied these measures:

1) All households switch current electric consumption to a 100% Green Electricity tariff:


2) 100% green electric powered heatpumps, Biomass and electric cooking instead of oil, gas and coal. For heatpumps it assumes replacing existing heat input with a heatpump with a COP of 3.0. See step 5 for a very basic application of building performance retrofit work.

Heatpumps form the cornerstone of supplying the remaining heat demand after retrofit in both Zero Carbon Britain and David MacKay's sustainable energy without the hot air. The performance of a heatpump is highly dependent of course on being designed, installed and controlled correctly.


3) Switch all petrol and diesel cars to electric cars powered by renewable electricity (Assuming mileage stays constant and an electric car performance of 4.0 Miles/kWh)

The ZeroCarbonBritain report from CAT suggests a reduction in the number of miles driven through a combination of increased use of pubic transport, walking, biking and better planning of where we live in relation to work/activities in addition to a switch to electric vehicles which are both more efficient than petrol and diesel cars and can be powered by renewable electricity.


4) Electric trains instead of planes:

In order to achieve the last 15% and still enjoy travelling long distances we would need a switch from flights to electric train journey's, the model here just assumes that the number of flight miles are replaced with electric train miles powered by renewable electricity and that the destination is reachable by train.


5) At least 120 kWh/m2.year primary energy for space heating and home electric.

Improving the thermal performance of buildings by adding insulation and improving the air-tightness should be one of the first measures applied and considered before or at the same time as any heating system changes as in step 2 above. The implementation of applying retrofit measures in the energy stack visualisation model here is only to set a maximum primary energy use requirement rather than to explore what's possible on a house by house basis which would give a better picture of the potential savings from retrofit work.


Powering Up with Renewable Energy

The ZeroCarbonBritain report goes into a lot of detail on how the remaining energy demand after applying power down measures can be supplied by renewable energy and also the need for storage technologies to manage the intermittent nature of a fully renewable energy supply. We didnt look into this as part of our study but it would be interesting to explore it in more detail in the future to answer questions such as: what scale of community energy projects such as community wind, solar and hydro should we be thinking of if we are to supply our energy demands after applying power down measures? and how much should we be thinking about energy storage in a more local context?

There's a lot of things that could be improved about the study. Rather than applying back of the envelope calculations on the effects of applying the various solutions to each house it would be better to look at each house in detail, carrying out a full detailed Carbon Coop home energy assessment for each house on how energy demand can be reduced by up to 70% through retrofit work.

Related links

OpenEnergyMonitor page on Sustainable Energy:
http://openenergymonitor.org/emon/sustainable-energy

The ZeroCarbonBritain report:
http://zerocarbonbritain.org/
Alice Hooker-Stroud, Centre for Alternative Technology, ‘Zero Carbon Britain (Energy)’

Sustainable energy without the hot air
http://withouthotair.com/

Carbon Coop
Charlie Baker's talk about carbon coop and 80% retrofit at the radical emissions reduction conference


Where next?
I would be interested to hear any thoughts on how to develop this work further, where it should go next. Feel free to email me if you have any ideas or would like to discuss: trystanlea at openenergymonitor.org

Testing KiCad PCB

We are always a fan of using open-source software wherever possible. A few years ago I briefly attempted to use open-source KiCad and gEDA PCB CAD software but found them very limiting, clumsy and buggy.

Recently there have been a raft of shiny looking browser based PCB design tools such as Circuit Maker and Upverter, these look very interesting; the online collaborative development opportunities are obvious and linking into the OctoPart's live component pricing, standard part library and BOM management tools could be a big time saver at the manufacturing stage. Maybe online tools will be the future, however I am a little reserved about having designs locked into a closed online platform.

In particular I have been keeping a close eye on KiCad developments after I heard CERN had got involved in the development. I was very impressed watching this video showing the newly developed KiCad intelligent semi-auto router in action:


I think it's time I gave KiCad another try! Today I managed to install KiCad and put together the RFM12Pi schematic and layout the board. Here's my experience:

I wanted the latest build to get the shiny new features, so I installed the development branch by adding the PPA to Ubuntu:

http://ppa.launchpad.net/js-reynaud/ppa-kicad/ubuntu

I installed KiCad build dated 16th July on 32-bit Ubuntu 14.04

I found I needed to add the line "export KIGITHUB="https://github.com/KiCad";" to my ~/.profile file to get rid of cannot find github footprint errors when running CvPCB (the program in KiCad which links the schematic parts to PCB footprints)

I followed the fantastic video tutorials from Contextual Electronics to help me get started.


1. KiCad Schematic Editor, net list must be manually exported to move to the next setp

2. Linking schematic parts to PCB footprints

3. Board layout the new interactive router was great (see video above)
New router options

Update: the finished Kicad RFM2Pi V2.7 design is up on github:

https://github.com/openenergymonitor/Hardware/tree/master/RFM2Pi/board/KiCad_RFM12Pi%20V2.7

Obviously we have considerable lock-in to EAGLE PCB with our historic designs and learning a new software tool is always going to be a slow and slightly frustrating process, however I'm quite impressed that after about 5hrs I think I'm got the hang of basic KiCad functions. I will seriously consider using KiCad for new designs in the future. I think the increased effort will be worthwhile to enable us to be using a fully open-source bit of design software to design open-hardware, what do you think?

Thinks I liked about KiCad:
  • Interactive router, very impressed with this. Big time saver
  • More intuitive setup of default track widths and net classes 
  • How net and pin names are displayed in the layout editor 
  • How schematic symbols and PCB footprints are handled as separate entities, more intuitive than Eagle IMHO  
Thinks I miss moving from Eagle:
  • Have a live link between schematic and PCB, KiCad requires exporting and re-importing a new netlist each time there is a change in schematic
  • There are more ready made parts in Eagle libraries then there are KiCad part libraries, but I'm sure this will change. 
  • Being able to highlight all tracks on a particular net by selecting a wire on the schematic (maybe I've just not found this feature yet in KiCad?)

Emonhub installation/update, replacing the PHP raspberrypi emoncms module

From Paul Reed's post on the forums here:
http://openenergymonitor.org/emon/node/5986

Emonhub is now the recommended method of interfacing a rfm12pi to a local or remote emoncms install, and replaces the PHP and Python scripts which we have previously used.

Update: This blog post refers to installing emonHub on existing system, if setting up a new system downloading the ready-to-go pre-built RaspberryPi image is the easiest way to get started.

Thanks to Paul Burnell, the author of emonhub, installation of emonhub can be achieved via a command line, which clones an installation script to automate the installation process.

To install emonhub:

$ git clone https://github.com/emonhub/dev-emonhub.git ~/dev-emonhub && ~/dev-emonhub/install

If you have the raspberry pi module already installed, it's important that it is removed prior to installing emonhub, as only one software can use the serial UART the RFM2Pi is connected to at any one time.

To remove the existing module, and then install emonhub, enter the following command line;

$ git clone https://github.com/emonhub/dev-emonhub.git ~/dev-emonhub && ~/dev-emonhub/upgrade

You will notice that after running this command, that emoncms will stop updating, this is expected until the configuration file is updated as follows;

$ nano /etc/emonhub/emonhub.conf

Enter your emoncms read/write api key in [[[runtimesettings]]] and also enter your rfm2pi frequency, group & base id under [[[runtimesettings]]]
Save your settings, and; $ sudo service emonhub restart

Problems?
View the error log; $ tail -f /var/log/emonhub/emonhub.log

By default this is set to record 'WARNING', however this can be changed to either - DEBUG, INFO, WARNING, ERROR, and CRITICAL by editing the configuration file.

Paul

NOTE - This update will not orphan or alter your input processes, feeds, visualizations or feed data, as it only changes the way in which data is fed to emoncms.

From the Forum: Using Modbus RS485 to read a SDM630M 3-phase meter


JBecker writes :

I am using a modified OpenEnergyMonitor energy monitoring hardware since more than a year now, with one voltage sensor and three CTs for the current measurement of the three mains phases. This system logs via the RFM12 and a Jeelink USB dongle to Emoncms on a Windows Home Server. This setup is running very reliably with an accuracy of better than ~4% compared to my power meter. I think it would be possible to get better accuracy by using individual voltage sensors on all phases.

In Germany the majority of household have three phase supply. To be able to use three voltage sensors it would be necessary to have three outlets within the distribution (for non-invasive mounting). I have never seen that. This means that you have to ask a friendly electrician to install these outlets. But then the whole thing is not really 'non-invasive' any more (and the OEM solutions becomes quite complex with a lot of cabling). This is a dilemma which is hard to solve.

So I came to another solution which is quite simple and uses mostly ready-made components:

I am using Chinese 3-phase energy monitors since some time for professional purposes (PV-Systems with battery storage). A very nice unit of this type is the Eastron SDM630M. This device has integrated shunts for current measurement, a nice little display and an RS485 interface for data readout with Modbus protocol. A lot of measuring values can be read, including imported and exported energy, phase voltages, currents, frequency, reactive power and so on. Parameters for the RS485 can also be set via four small keys and the display.


For data storage and visualization I decided use the new Emoncms 'low-write' version on a Raspberry Pi. This was installed according to the installation instructions and worked 'out-of-the-box'. The only thing missing on the RasbPi for direct connection to the SDM630 is an RS485 interface.


To be able to use the already existing software for data collection on the RasPi (Emonhub), I simply made a 'clone' of the RFM12Pi module. This now has an RS485 driver onboard instead of the RFM12 RF transceiver. Software on the RS485Pi board is the Opti-bootloader (same as on RFM12Pi) for Arduino compatibility and a small sketch for data readout via modbus. As the only available hardware UART is already used for communication with the RasbPi I had to use a software serial for the RS485 interface. (The 'ModbusMasterSoft' library I use is a dirty hack of the existing ModbusMaster library and the AltSoftSerial library. I found no decent way to make these two work together, so I had to modify them)

So the whole installation now consists of:

- a Raspberry Pi with power supply and the RS485Pi interface board

- the SDM630 energy meter

(- and a cable in between :-))

See forum thread for schematic and code: http://openenergymonitor.org/emon/node/5743


A right to build: An open approach to housing provision: self-provision


http://issuu.com/alastairparvin/docs/2011_07_06_arighttobuild
A right to build is a booklet written by Alaistair Parvin of (00 and Wikihouse), David Saxby, Cristina Cerulli and Tatjana Schneider that outlines a clear and comprehensive vision for how a self-provision approach to housing could be the best way to tackle the UK housing crisis while delivering higher quality, higher performance low energy housing.

Its a deeply inspiring vision of the potential power that empowering, distributive, open ways of doing things, that gives us all agency, to participate in solving problems like climate change can have.

'A right to build' starts by making an observation that we have become accustomed to an assumption that progress in production is the expansion of mass-produced goods, built by professionals and mass-consumed by citizens, a legacy of the industrial revolution, but far from progress the report provides a strong case that the large house builder model has actually resulted in a deterioration in the quality of housing when measured against modern examples of self-provision and self-build.

Driven by a combination of massive house price inflation over the last 40 years and the associated treatment of homes increasingly as financial assets, the incentives for higher quality housing has been sidelined with financial values being pursued over use value.

Who should build?

“The question is not ‘What homes do we need?, but rather ‘Who should build them?’ “ - A right to build.

Self-provision


Self provision of housing is a spectrum of models, the most common characteristic is that the first owners act as the client commissioning their own home. Beyond this there is a varying degree of involvement. From contracting out all of the work or doing a lot of the work yourself (self-build).

Advantages to self-provision:

Self provision fundamentally transforms the kind of houses and neighbourhoods that get built:
  • Designed for long term use-value, higher quality: affordability, generosity, sustainability, flexibility, community. Form of production that is structured around valuing those things.
  • Increased affordability. Overall cost often a third less and can be even less if you use your own 'sweat equity' (do a proportion of the building work yourself).
  • More innovative, more likely to explore more innovate architectural styles and newer and higher performing low energy building materials. More likely to create spaces that lead to further innovation: workshops, garages.
Self-provided housing is intrinsically more capable of delivering better outcomes because the developer is the user.

Removing barriers to participation

“The most challenging, but most crucial aspect of scaling the self-provided housing sector is not just increasing capacity for the current self-providing demographic, but coming up with innovative models which lower the economic threshold for participation.”

It mentions the Walter Segal system for self-build conceived in the 1960s and 1970s which is one historical example of an attempt to do this.
  1. Used an affordable, widely available and easy-to- work with material: timber.
  2. Lowered the skill-threshold for self-builders. With a bit of basic training and common sense, even those who didn’t have mainstream construction skills could put together a Walter Segal house.
Alaistair Parvin and 00's more recent project is wikihouse an open source low energy affordable home construction system that makes use of modern CNC manufacturing methods and self assembly on site. Wikihouse has a growing global community of people developing design's, sharing them openly online and prototyping these housing solutions. Like Walter Segal's system the aim is to lower the economic threshold for participation both by creating an open source self-build system and all the learning resources and collaboration, peer to peer support systems that can come from online open source projects.

Towards the end of the report a very good point is made about the mistaken attitude and opportunity lost that often classifies the professional-citizen relationship:

“Thirdly, by treating citizens only as passive users of a finished commodity provided by professionals, it can actually decrease the usefulness and quality of that commodity (as this booklet has argued in the case of housing) and decrease also the self-reliance and mutual support within communities. Citizens can be treated as passive, rather than active users, and their potential value can be overlooked. As the New Economics Foundation wrote in their 2008 pamphlet on the subject:


“The reason today’s problems seem so intractable is that public services, and technocratic management systems, have become blind to the most valuable resource they possess: their own clients and the neighbourhoods around them. When these assets are ignored or deliberately side-lined, then they atrophy.””

This is arguably one of the key principles of open source which is perhaps one of the clearest definitions of a system that enables this, a phrase commonly found in open source projects is that this project is open for everyone. Its open to everyone to make build, improve, modify, share, learn.

By treating fellow citizens as co-developers, fellow self-providers as equal contributors rather than passive consumers it unlocks this capacity that we all have.

Read the A Right to build here http://issuu.com/alastairparvin/docs/2011_07_06_arighttobuild

Alaistair Parvin's TED talk: http://www.ted.com/talks/alastair_parvin_architecture_for_the_people_by_the_people

Wikihouse: http://wikihouse.cc/

Monitoring SolarPV, Heatpump and house electric, EmonTx v2 system upgrade example

Several years ago we did a community energy monitoring project in our local area, Penrhyndeudraeth, North Wales. It involved installing 20 openenergymonitor energy monitors in 20 households and carrying out energy assessment looking at electricity, heating and transport, there is a little more about it and some of the tools we developed here.

The houses that where most engaged in the monitoring part of the project still have those energy monitors installed and yesterday I went to upgrade one of these systems, I thought Id write a blog post on what I did (written half as a guide) as it might be useful for those using older hardware such as the emonTx V2 and its also quite an interesting example of what you can do with the monitoring system.

The upgrade essentially involved replacing a first generation nanode basestation with a RaspberryPI basestation running the latest image and also upgrading the emontx v2 that was in place with new firmware that both does the higher accuracy continuous sampling (developed by Robin Emley) and the watt hour calculation on board.

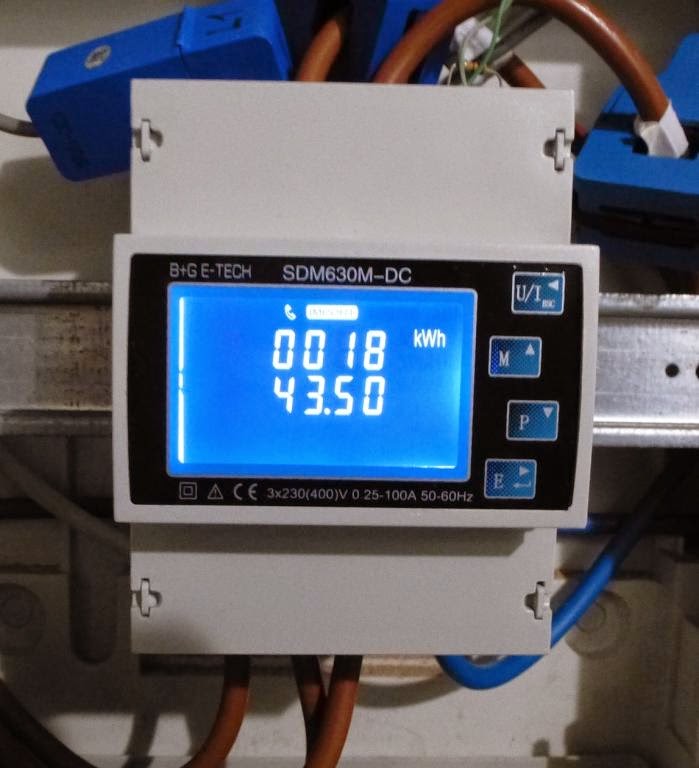
This particular system is measuring Solar PV generation, household electric consumption and the electrical consumption of a heatpump. It has an EmonGLCD Display running the SolarPV firmware, with the red/green glowing ambient light depending on whether more power is being used than generated or vice versa and the data is also posted to emoncms.org for graphing.

Here's a system diagram:

EmonTx:

Upload to the EmonTxV2 the continuous sampling + watt hour firmware:
https://github.com/openenergymonitor/emonTxFirmware/tree/master/emonTxV2/emonTx_continuous_watthours 

The same thing can of course be achieved with an EmonTxV3 but with the added benefit of a fourth channel and only needing the one ACAC Power adapter. If you have the EmonTxV3 upload the continuous sampling + watt hour firmware found here: https://github.com/openenergymonitor/emonTxFirmware/tree/master/emonTxV3/RFM12B/Examples/emonTxV3_continuous_kwhtotals_noeeprom

EmonGLCD
Open the SolarPV example: https://github.com/openenergymonitor/EmonGLCD/tree/master/SolarPV

On lines 68 and 69 change the emontx radio packet defenition from:

    typedef struct { int power1, power2, power3, Vrms; } PayloadTX;
    PayloadTX emontx;


to:

    typedef struct {
        unsigned long msgNumber;
        int heatpump; // heatpump
        int power1; // house power
        int power2; // solar power
        long wh_CT1;
        long wh_CT2;
        long wh_CT3;
    } PayloadTX;
    PayloadTX emontx;


I've named the second variable here heatpump instead of power1 and then powers 1 to 3 because power1 and power2 are used as house power and solar power lower down in the firmware.
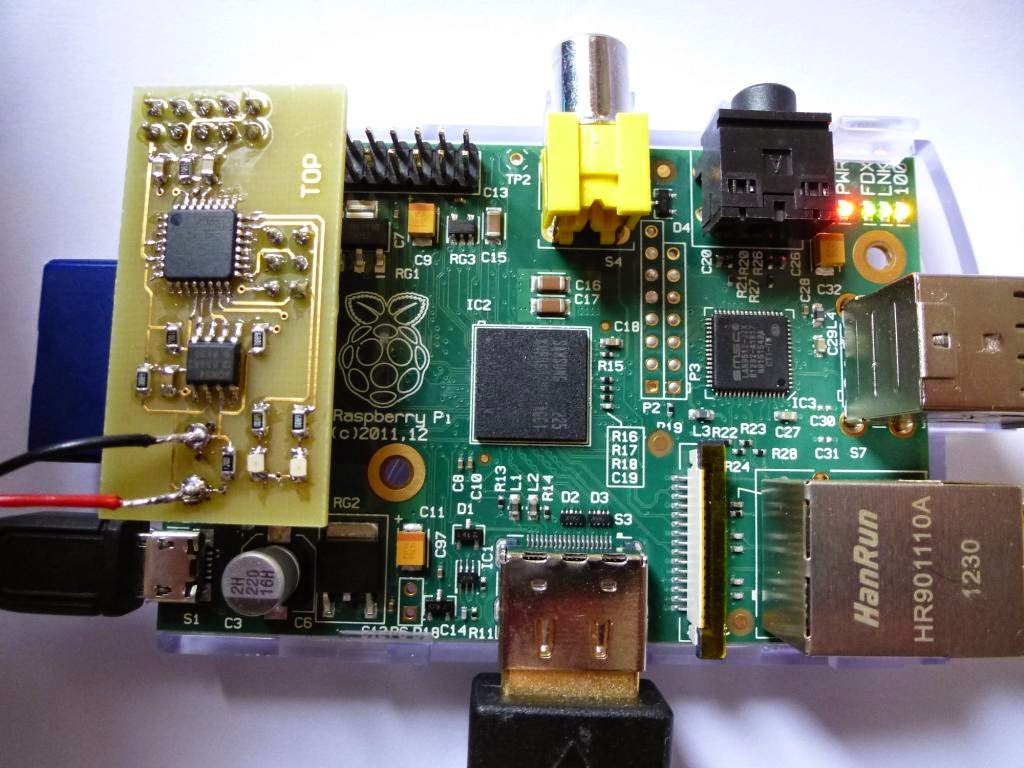
RaspberryPI Basestation
I used the latest (28th of July emonSD image) that has EmonHub (thanks to Jerome and Paul Burnell) and emoncms ready to go but without the local emoncms installation enabled, the PI was just used as an EmonHub gateway forwarder to emoncms.org. I used the nice pimoroni berryblack raspberrypi case so that the installation was tidy.

Download ready-to-go image: emonSD-13-08-14.img.zip [link updated]

To configure EmonHub to post to emoncms.org, SSH into the raspberrypi and put the PI in read/write mode with:

    rpi-rw

and then open the emonhub configuration file:

    nano /boot/emonhub.conf

Set the dispatcher url to: http://emoncms.org and the apikey to your emoncms.org account write apikey.

In order to decode the emontx continuous + watt hour radio packet add a node decoder to the nodes section in the emonhub config file at the bottom:

    [nodes]
    [[10]]
        Datacodes = L,h,h,h,l,l,l


Secure the pi user by changing the password (the default password is raspberry)

    passwd

Place the PI back in read only mode:

    rpi-ro

Emoncms configuration

With the emontx running and the raspberrypi configured as above the inputs will now appear in emoncms.org, but they will be un-named. For this particular installation I named them as in the picture below to correspond to the radio packet format and what I knew I was monitoring on each CT channel.

I then logged each of the power inputs to a fixed interval with averaging (PHPFiwa) feed and used the Wh Accumulator input processor to record the Watt hour totals. The Wh Accumulator checks if the watt hour total has reset and if it does it continues the accumulation from the last point. I used the fixed interval without averaging feed engine for the watt hour feeds.


To make use of the higher accuracy calculating of watt hours on the emontx and the recording of watt hour feeds, there is a slightly different procedure for creating dashboard kwh per day graphs:

Creating a daily electricity consumption graph in a dashboard using watt hour feeds (instead of the old power_to_kwhd method).  


Create a new dashboard and select visualisations > bargraph.

Click on the bargraph and click configure to bring up the configuration dialog. Select the watt hour feed that you want to display daily totals from, enter interval, units, dp, scale and delta=1 as below: (Note that you could change the interval here to any interval: hourly, half day, week etc)

Click save and continue to add any other text and widgets as required. A simple dashboard showing daily consumption and the current power could look like the screenshot below and could be repeated adding a graph for each channel, heatpump, solarpv and house consumption.


Pebble Smart Watch Emoncms Heating Control Demo

This post follows on my post a while back on Emoncms heating control, and links in with my previous post on using Tasker to display Emoncms notifications. For details of the hardware and overview of the heating control setup, see the Emoncms heating control post linked above.

The Pebble is a Bluetooth connected smart watch which works with Apple and android smartphones. Using an e-ink display the Pebble watches achieves a week of battery life. Very impressive from a hardware point of view. I've been using a Pebble with my android phone for the past couple of weeks and found the Pebble to be useful for keeping up with notifications while out out and about and especially for controlling music, navigation directions and activity tracking while out biking, running, driving and even swimming!

The thought occurred to me that the Pebble could potentially be a super convenient way to quickly control my heating. I've got working a simple demo to turn my heating on and off, the could easily be extended to allow setting a set point.

When the Pebble was first released my friend Ryan Brooks put together a demo to display feed data from Emoncms on the pebble. The code for this demo is up on GitHub, however since then things have moved on, Pebble have released SDK 2.0 and launched the pebble app store allowing many applications to be easily loaded onto the Pebble. One of the more powerful applications is Pebble Tasker, when linked with the main Tasker App on an android phone the possibles are endless. See my previous blog post on using Tasker to display Emoncms notification on an android phone. Taking inspiration from Nathan Chantrell's home automation setup using Pebble and Tasker I decided to have a go at directly controlling my heating from my Pebble, here is the result:


Here are the steps to replicate this system:

1. Install Emoncms on a Raspberry Pi and enable RF12 Packetgen Module 

I used the new pre-built SD card image for the low write version of emoncms, downloadable from the link below. This is soon to become our default Raspberry Pi pre-built image once testing is complete

Following the setup guide enable local logging and configure emonHub

The heating control setup requires the emoncms Packetgen module. Follow the steps to enable packetgen to work with emonHub. 
More info on packetgen module can be found: https://github.com/emoncms/packetgen

2. Setup RFM12B receiver and control relay 

To perform the actual control of the boiler you will need to setup an RFM12B receiver node with a relay or similar. The actual hardware setup will depend on what you want to control, a JeeLink or partially populated emonTx V2 work well as a good base for the control hardware. See my previous post on heating control for more info regarding the hardware. The packetgen module will provide an example Arduino sketch to upload. 

3. Install and Configure Tasker on your android Phone 

https://play.google.com/store/apps/details?id=net.dinglisch.android.taskerm

The emoncms API to set a packetgen variable is as follows:

http://YOUR_EMONCMS_SERVER_IP_OR_HOSTNAME/emoncms/packetgen/update.json?id=4&value=1&apikey="YOUR_RW_APIKEY"

ID is the id of the packetgen variable (they start at 0) and value is the value to be set, the example above will turn the heating on setting variable 4 which in my setup is a boolean control variable to '1'. You can test if this is working by calling the API in your browser.

I've created a Tasker template task which calls the above API which can be downloaded from Github and imported into Tasker, follow instructions on Github Readme. Variables should be self-explanatory.

https://github.com/emoncms/androidTasker


If a successful response is received from the Emoncms server a 'success' notification is displayed, else a fail notification is activated. 


Home screen Tasker task shortcut widgets can be created on your android home screen to allow Tasker tasks to be easily activated, or profiles can be setup to turn the heating on as you arrive home / leave work or certain times per day. The possibles are endless! Just make sure your system has some hardware fail-safe so you don't get home to a house like a sauna or worse!


If you are setting up Tasker yourself from scratch setup GET requst as follows:

New Task > + new action > net > HTTP GET > enter HTTP API above into host and (optionally) write output to log file 


4. Install & configure Pebble Tasker on the Pebble Watch


To map Tasker tasks to allow easy control from a Pebble 


Other Pebble Tweaks I've found useful

While not directly relevant to heating control here are some further details of my Pebble smartwatch setup: 

  • Using PebbleBits firmware on the pebble to quickly launch pebble apps from the watch face
  • Using Tasker to Stop / Start Strava 
  • Modern Watchface is my favourite watch face (shown in demo above)
  • Music Boss is great for controlling music and starting podcasts while driving or biking
  • NavMe is great for directions on the Pebble while on the bike  
  • Tasker can be used to send commonly sent SMS's and call favourite contacts direct from the Pebble 


Android Tasker & Pebble Smartwatch - Emoncms Notifications

Tasker is a powerful android app which can be used to automate all sorts of things on your phone or tablet.

Using Tasker it's easy to create notifications using data from Emoncms to be triggered by certain events e.g. times of day, location, feed value etc. The possibilities are endless! Once you're done configuring Tasker it's possible to export your setup packaged as an android app to be easily installed on any device.

Using Pebble Notifier (which integrates with Tasker) the notification can be sent to a Pebble Smartwatch. Pebble Tasker can be used to activate the task to trigger the notification directly from the watch.


Here's the Tasker task I used to perform the notification show above, I have setup Tasker profile to activate this notification whenever I get home and at the end of the day at 11pm.  


I have uploaded a generic version of this Tasker task to GitHub, follow the instruction on the GitHub Readme to import into Tasker. 


How CT Sensors are Made...

Ever wondered how CT sensors are made? I've just been sent these photos of inside the YHDC factory, here we can see the CT windings being wound: