Blog
OpenEnergyMonitor

Interpreting Emoncms Dashboards


The emonPi / emonTx standard install is designed to monitor whole house power consumption. An excellent learning exercise that we recommend everyone undertake soon after installing a whole house energy monitor is to turn off every appliance in the house then slowly turn on each appliance keeping a close eye on the real-time Emoncms dashboard. Walking around the house using a handheld mobile device to display the Emoncms dashboard works great for this. For fastest response we recommend connecting to the local Emoncms running locally on the emonBase / emonPi which will update ever 5s (emonPi default) or 10s (emonTx default).

After this exercise you should have a good idea what the trace signature of each of your appliances looks like on the graph. The easiest to identify are the large power consumers e.g kettle 3kW spike and shower 8kW spike. However with a bit of observation it's possible to identify subtler power signatures. Here's an excellent example by posted by @Zapaman showing a Solar PV dashboard annotated to identify his fridge / freezer and central heating pump running over night. It's great to see the solar PV kick in providing more then the demand when the sun hits the panels in the morning :-)


Ambient Wind Energy Indicator using Node-RED and Blink(1) USB

As we move to a low carbon electric grid with large amount of input from renewable sources we will need to match our consumption of energy to generation. The wind will not always blow and the sun doesn't always shine. Grid energy storage will play a role, however the closer we can match our consumption of energy to generation the less storage will be required. In the future we can expect dynamic pricing to act as as an incentive for shifting consumption patterns. 

As an experiment I have been playing around with creating a real-time ambient indicator of UK wind energy generation. Since wind energy is the greatest input of renewable energy into the UK grid we can assume that when wind generation output is high this is the best time for us to use power e.g. run the washing machine, dish washer etc.. 

I've used emoncms.org,  Node-RED and a ThingM blink(1) USB RGB LED plugged into an emonPi energy monitor to create the indicator.

Real-time wind energy indicator

Blink USB Indicator

First let's install the software to control the Blink(1) USB on the emonPi / RaspberryPi:

$ git clone https://github.com/todbot/blink1
$ sudo cp ~/blink1/linux/51-blink1.rules /etc/udev/rules.d/
$ sudo udevadm control --reload-rules
un-plug then re-plug device
$ cd blink1/commandline
$ make

Note: if Node HID fails to compile you may need to install gcc-4.8. I did not experience this problem using Raspbian Wheezy: https://github.com/node-hid/node-hid/issues/115

Test it's operation by turning on a white LED with
$ ~/blink1/commandline./blink1-tools --on

To make the Blink(1) USB work with Node-RED we need to install the Blink(1) node-RED flow and libusb driver. If you haven't already got it installed this example also requires the emoncms noe-RED flow to pull data from emoncms.org

$ sudo apt-get install libusb-1.0-0.dev
$ cd ~/.node-red
$ npm install node-red-node-blink1
$ npm install node-red-node-emoncms

Then restart node-RED.

Node-RED makes it super easy to link the required software components together, with pre built nodes available for emoncms and Blink USB it's just a case of linking the nodes together and adding some logic. Here is now node-RED flow, see node-RED export at bottom of this post:


We have a script running on emoncms.org to pull in real-time UK wind energy generation. We have been logging this data for almost a year now. Checkout the dashboard here: http://emoncms.org/mywindpower/ukwind.

http://emoncms.org/mywindpower/ukwind

The read API key for this account is 8f5c2d146c0c338845d2201b8fe1b0e1 and the feed ID is 67088. To pull the real time data into node red just plug in the  api key and feed ID into the node-RED emoncms in node. Node-RED will then execute the following GET request:

The blink usb node requires RGB csv to represent a colour output. A node is used to map the generation 0 -  7000 MW (currently!) to 0 - 255 RGB representation. 


[{"id":"98c24074.673dc","type":"emoncms-server","server":"http://emoncms.org","name":"emoncms UK windpower"},{"id":"5a3294d0.a5cd6c","type":"function","name":"Create RGB values CSV","func":"// convert to integer \n//var wind = +msg.payload;\n\n// green = 255 @ max wind output\nvar g = msg.payload\n\n// red = 255 @ zero wind output\nvar r= 255 - msg.payload\n\n// Round to whole number\ng = Number((g).toFixed(0));\nr = Number((r).toFixed(0));\n\nvar csv = r + \",\" + g + \",\" + 0;\nreturn {payload:csv};","outputs":1,"noerr":0,"x":617,"y":348,"z":"c0b0c402.3f4f38","wires":[["52d8719f.ad279","f3dd00d0.0c23"]]},{"id":"6ec040ed.913fc","type":"inject","name":"Trigger every 10min 7AM-11PM","topic":"","payload":"1445415635","payloadType":"string","repeat":"","crontab":"*/10 7-22 * * *","once":false,"x":297,"y":261,"z":"c0b0c402.3f4f38","wires":[["68f8d790.970728"]]},{"id":"52d8719f.ad279","type":"debug","name":"","active":false,"console":"false","complete":"false","x":878,"y":334,"z":"c0b0c402.3f4f38","wires":[]},{"id":"b5d43139.4a2bd","type":"inject","name":"Test 100MW","topic":"","payload":"100","payloadType":"string","repeat":"","crontab":"","once":false,"x":223,"y":421,"z":"c0b0c402.3f4f38","wires":[["2da76a85.d25896"]]},{"id":"9122dd65.6edd2","type":"inject","name":"Test 2000 MW","topic":"","payload":"2500","payloadType":"string","repeat":"","crontab":"","once":false,"x":225,"y":469,"z":"c0b0c402.3f4f38","wires":[["2da76a85.d25896"]]},{"id":"b5c8e6e5.4a3718","type":"inject","name":"Test 5000MW","topic":"","payload":"5000","payloadType":"string","repeat":"","crontab":"","once":true,"x":224,"y":514,"z":"c0b0c402.3f4f38","wires":[["2da76a85.d25896"]]},{"id":"f3dd00d0.0c23","type":"blink1","fade":"600","name":"Blink(1) USB","x":847,"y":440,"z":"c0b0c402.3f4f38","wires":[]},{"id":"68f8d790.970728","type":"emoncms in","name":"Get UK wind generation output from emoncm.org","emonServer":"98c24074.673dc","feedid":"67087","x":263,"y":343,"z":"c0b0c402.3f4f38","wires":[["2da76a85.d25896"]]},{"id":"2da76a85.d25896","type":"range","minin":"0","maxin":"6000","minout":"0","maxout":"255","action":"clamp","round":true,"name":"Range: Scale wind output to RGB value","x":551,"y":417,"z":"c0b0c402.3f4f38","wires":[["5a3294d0.a5cd6c"]]},{"id":"64a3fa26.9b5c04","type":"inject","name":"Turn off after 11PM","topic":"","payload":"0,0,0","payloadType":"string","repeat":"","crontab":"01 23 * * *","once":false,"x":613,"y":488,"z":"c0b0c402.3f4f38","wires":[["f3dd00d0.0c23"]]}]

emonPi, NodeRed and MQTT

Using the emonPi in it's default configuration works great to post data to Emoncms for logging and visualisation. However there may be times when you want some more flexibility and or ability to interface with other hardware.

Using a tool called Node-Red the emonPi can become a central hub for home automation, control and notification. Node-RED is a tool for wiring together hardware devices, APIs and online services in new and interesting ways. At the heart of Node-RED is a visual editor allowing complex data flows to be wired together with only a little coding skills.  Here are some of my ideas of things I might like to achieve with Node-RED, For more inspiration check out Martin's IoT Google hangout 29min in:


Install Node-RED on emonPi / emonHub / Raspberry Pi 

Make emonPi file-system RW:
$ rpi-rw

Install Node-RED (taken from node-RED RaspberryPi install guide):
$ curl -sL https://deb.nodesource.com/setup_0.12 | sudo bash - 
$ sudo apt-get install -y build-essential python-dev python-rpi.gpio nodejs
$ sudo npm install -g --unsafe-perm node-red

Open up port 1880 so we can access Node-RED editor:
$ sudo iptables -A INPUT -p tcp -m tcp --dport 1880 -j ACCEPT

Open up port 1883 so we can access MQTT server:
$ sudo iptables -A INPUT -p tcp -m tcp --dport 1883 -j ACCEPT

Make iptables rules persistent
$ apt-get install iptables-persistent

Choose yes to save rules, if needed edit the persistent rules:
$ sudo nano /etc/iptables/rules.v4


Start Node-RED with:
$ node-red-pi --max-old-space-size=128

To view the node-RED graphical editor browse to:
http://emonpi:1880/ (or use IP address if this does not work)

To use Node-RED as a permanent setup you will want to set it up as a service to autostart at boot and enable secure authentication access to node-RED editor.

When you are done don't forget to put the emonPi back to read-only mode to preserve SD card lifespan:
$ rpi-ro

Getting data from the emonPi into Node-RED

There are two options to get our energy data into Node-RED:

1. Real-time data from emonHub using MQTT (see example below):

MQTT is a lightweight communication protocol for small web-connected devices. The latest version of emonHub as setup on the emonPi (and emonHub from July 15) uses MQTT as a link to Emoncms and also to provide data to the emonPi LCD script. Since MQTT is already running all we need to do is to point Node-RED MQTT input block to subscribe to the 'emonhub/rx/#' MQTT topic on port 1883. The '#' topic includes data received from all nodes. To subscribe to just one node use e.g. emonPi use: 'emonhub/5/values' or 'emonhub/10/values' for emonTx.

To subscribe the the emonPi's MQTT topics externally (if your running node-RED on another machine) you will need to open up the MQTT port on the emonPi:

$ sudo iptables -A INPUT -p tcp -m tcp --dport 1883 -j ACCEPT

2. Historic data from Emoncms using HTTP API: 

To pull historic data already logged to Emoncms (e.g KWh data) into Node-RED we can use Emoncms's API. Here is a simple example to pull in the latest value from the KWh feed, just enter your RW API key and feed ID:

http://emoncms.org/feed/value.json&apikey=APIKEY&id=FEED_ID

To view all Emoncms API see: http://emoncms.org/input/api

Node-RED example: send warning email when emonTH battery is low


Simple but useful example, use Node-RED connecting to emonPi in real-time data via MQTT (localhost) and sending email (via Gmail SMTP) if emonTH battery drops below 1.7V. Also in this flow as an example is a node to decode emonPi power data.


Here is the contents of each node: 
MQTT Node subscribing to emonhub mqtt topic on localhost (running node-RED on emonPi)
Separate node to split the MQTT data up into nodes based on ID: e.g emonTx = 10, emonPi = 5, emonTH = 19
CSV node to split up MQTT CSV string
If function node
email node, enter your Gmail (or otherwise) SMTP login

Node-RED flow export, import by copy and pasting into import>clipboard in Node-RED editor:

[{"id":"eb57a13e.14a86","type":"mqtt-broker","broker":"localhost","port":"1883","clientid":""},{"id":"44c7eefa.bb381","type":"mqtt in","name":"MQTT: emonhub/rx/#","topic":"emonhub/rx/#","broker":"eb57a13e.14a86","x":159,"y":386,"z":"fa6ca080.05936","wires":[["2c7fcc53.d38034","eb7e04d9.1481f8"]]},{"id":"2c7fcc53.d38034","type":"debug","name":"RAW MQTT output: emonhub/rx/#","active":false,"console":"false","complete":"topic","x":242,"y":461,"z":"fa6ca080.05936","wires":[]},{"id":"eb7e04d9.1481f8","type":"switch","name":"Seperate Nodes","property":"topic","rules":[{"t":"cont","v":"5"},{"t":"cont","v":"19"},{"t":"cont","v":"20"}],"checkall":"true","outputs":3,"x":343,"y":317,"z":"fa6ca080.05936","wires":[["b0618044.4f9e8"],["9077dea0.6f882"],[]]},{"id":"9077dea0.6f882","type":"csv","name":"emonTH 1: emonhub/19/values > Decode MQTT CSV","sep":",","hdrin":"","hdrout":"","multi":"one","ret":"\\n","temp":"temp,temp_external,humidity,battery,pulsecount","x":664,"y":373,"z":"fa6ca080.05936","wires":[["75ee731f.8a118c"]]},{"id":"b0618044.4f9e8","type":"csv","name":"emonPi: emonhub/5/values > Decode MQTT CSV","sep":",","hdrin":"","hdrout":"","multi":"one","ret":"\\n","temp":"power1,power2,power1_plus_2,Vrms,temp1,temp2,temp3,temp4,temp5,temp6,pulseCount","x":647,"y":236,"z":"fa6ca080.05936","wires":[["cda897fa.325768"]]},{"id":"cda897fa.325768","type":"debug","name":"Debug: emonPi Power1 output","active":false,"console":"false","complete":"payload.power1","x":1015,"y":235,"z":"fa6ca080.05936","wires":[]},{"id":"75ee731f.8a118c","type":"function","name":"If emonTH battery < 1.7V","func":"if (msg.payload.battery < 1.7) {\n   return {payload:'WARNING: emonTH battery low  '+msg.payload.battery+'V'  };\n}","outputs":1,"noerr":0,"x":1015,"y":363,"z":"fa6ca080.05936","wires":[["f8d8fd72.0727"]]},{"id":"f8d8fd72.0727","type":"delay","name":"Limit 1 email per day","pauseType":"rate","timeout":"5","timeoutUnits":"seconds","rate":"1","rateUnits":"day","randomFirst":"1","randomLast":"5","randomUnits":"seconds","drop":true,"x":948,"y":447,"z":"fa6ca080.05936","wires":[["1d4154b2.e2beab"]]},{"id":"1d4154b2.e2beab","type":"e-mail","server":"smtp.gmail.com","port":"465","name":"","dname":"Send warning email","x":1198,"y":439,"z":"fa6ca080.05936","wires":[]}]

China Shenzhen Electronic Market & HopeRF Factory Visit


For the past two weeks I have been travelling out to the South of China from the UK via overland travel. I have always wanted to visit China but could not bring myself to justify the carbon impact of flying*. My journey took me from the UK to Moscow via European trains then the Trans Siberian Railway across Russia and Mongolia to China. It was a fantastic adventure, we broke up the travel by stopping off in various locations on route. I have posted a couple of blog posts on my personal blog accounting the journey.


Even though at OpenEnergyMonitor we do most of our manufacturing and assembly locally in the UK there are many components that are only possible to source in China e.g CT sensors, power adapters and RF modules. In fact most electronic components originate in some way from a factory in China. Even though we do our SMT assembly and PCB fabrication in the UK we still rely heavily on Chinese manufacturing. For heavy items like power adapters and CT sensors we purchase in bulk (pallet load) and ship via ocean freight rather than air cargo to reduce carbon footprint.

I wanted to visit China to experience the culture and see for myself the working conditions in the factories that supply some of the components we use. No doubt attempting to trace back every factory and company in a supply chain for a complex items such as electronic components is a big task, something large corporation (think Apple and Samsung) have struggled with. We have all heard the horror stories of overworked and under-age employees in Chinese electronic factories.

My epic train ride to China rolled me into the North of China and Beijing first. After being a tourist for a day and visiting the very 'great' Great Wall of China I took a fast train down to Shenzhen. This train was seriously impressive, cruising at a smooth 307 Km/hr. I was glued to the window watching countryside and cities larger than London that I had not heard of fly by. I was aware that China is home to many, many people however this was really evident looking out the window watching huge cities and row upon row of skyscrapers flash by. In every town town and city it seemed many more tower blocks were in the process of being built, there is no doubt that China is undergoing an economic boom. After 8hrs of fast train blur we arrived in Shenzhen, nicknamed together with it's neighbouring city Guangzhou as the ‘factory of the world’; it's almost certain that the laptop/tablet/phone you are using to read this was made in factories in these cities.

During my time in Shenzhen I visited the world's largest electronic component market and the HopeRF factory where the RFM12B and RFM69CW RF modules that we use are designed and manufactured. I didn't manage to visit the factory where our CT sensors are manufactured since this factory was located in the north of China, however I did post up some photos I was sent from inside the factory a while back.

Electronic component market in downtown Shenzhen (I'm pictured with the seller of encapsulated DS18B20 temperature sensors that we stock)


Visiting the electronics market in downtown Shenzhen was a fantastically crazy experience. It was amazing to see all types of components carefully organised under the glass counters. There is something satisfyingly tactile about being able to hold different types of connectors and switches to compare quality and dimensions and chat to the seller about the pros, cons and cost of each item. Assuming you could speak Mandarin shopping for components here would be a far more social experience than an online parametric search tool! Obviously prices for these components are significantly cheaper than in the West.

Before I started working in electronic manufacture I assumed (like I think many people do) that most electronic manufacture is performed by robots. This is mainly true for pick-and-place assembly, however there are many more manufacturing steps which require significant human effort such as thru-hole soldering, testing and final assembly.

I am happy to report that the HopeRF I visited was clean, air conditioned and all employees were at least the minimum age, paid at least the minimum wage and worked 8am - 6pm with a 2hr lunch / siesta break. Overtime is common but employees are paid accordingly. All employees I met seems happy, although I did happen to arrive just as they were leaving on their lunch break! On the wall in the corridor there was a notice board with photos showing various company employee group outings including activities such as hill walking, running, swimming and group dinners. I also noticed an employee suggestion box.

Hope RF Factory Visit


I did get a chance to speak to an engineer at Hope RF who is involved in the design of new modules. As I had presumed the RFM69CW using a more standard IC package is much more suited to reflow soldering and less susceptible to humidity ingression than the older RFM12B design that often used a 'black blob' IC package. Second photo down on the left shows a naked RFM12B before receiving it's 'blob' dressing! Interestingly I learned (and witnessed!) that each and every single module is hand tested before leaving the factory. Modules that fail the test are debugged by hand. I was told that they have no plans to halt manufacture of the older RFM12B modules as long as there is demand.

HopeRF factory in Shenzhen where RF modules are designed, manufactured & tested.


* Travelling via train emits 80-90% less carbon then flying [Source: http://www.seat61.com/CO2flights.htm].

The international 'safe' level of emissions per person is around 2T/yr to contain global temperature changes at or below 2 deg C which will 'hopefully' keep runway climate change and subsequent rise in sea levels at bay. Return fight from London to Málaga will emit 2/3T of carbon per person

6.5T to Auckland Australia or 2T to New York. [Source: Only Planet, Ed Gillespie 2014]

Using emonPi Offline: How to setup a WIFI Hotspot on an emonPi

This guide details how to setup a WIFI Hotspot using the Edimax USB WIFI adapter on an EmonPi or EmonBase to make it possible to connect directly to an EmonPi from a tablet or computer without the need for a router or internet connection.

The guide is based on Dave Conroy's guide here but also covers setting up a DHCP server rather than ethernet to WIFI bridge.

There are 3 pieces of software that need to be installed to get this to work:
  • hostapd – WIFI Hotspot
  • edimax version of hostapd
  • isc-dhcp-server – DHCP Server
1) Install dhcp server 

sudo apt-get install isc-dhcp-server 

2) Install Edimax version of hostapd

Either use precompiled binary or compile yourself:

Pre-compiled (update: does not seem to work with wheezy, use self compile see below)
wget http://www.daveconroy.com/wp3/wp-content/uploads/2013/07/hostapd.zip
unzip hostapd.zip
sudo mv /usr/sbin/hostapd /usr/sbin/hostapd.bak
sudo mv hostapd /usr/sbin/hostapd.edimax
sudo ln -sf /usr/sbin/hostapd.edimax /usr/sbin/hostapd
sudo chown root.root /usr/sbin/hostapd
sudo chmod 755 /usr/sbin/hostapd


Compile yourself (recommended for wheezy, tested March16)

sudo apt-get install libnl-genl-3-dev libnl-3-dev
git clone https://github.com/lostincynicism/hostapd-rtl8188
cd hostapd-rtl8188/hostapd
sudo make
sudo make install 

3) Configure /etc/network/interfaces

Open the network interfaces file to edit:

sudo nano /etc/network/interfaces

Replace content with:

auto lo
iface lo inet loopback

auto eth0
allow-hotplug eth0
iface eth0 inet manual

#allow-hotplug wlan0
#iface wlan0 inet manual
#    wpa-conf /etc/wpa_supplicant/wpa_supplicant.conf


iface wlan0 inet static
address 192.168.42.1
netmask 255.255.255.0

allow-hotplug eth1
iface eth1 inet dhcp

If required add bridge to bridge eth0 to wlan0 - although it's better to use NAT iptables forwarding since then we can still access pi via ssh (see below)

auto br0
iface br0 inet dhcp
bridge_ports eth0 wlan0
pre-up ifconfig eth0 0.0.0.0 up
pre-up ifconfig wlan0 0.0.0.0 up
pre-up brctl addbr br0
pre-up brctl addif br0 eth0
post-down ifconfig wlan0 0.0.0.0 down
post-down ifconfig eth0 0.0.0.0 down
post-down brctl delif br0 eth0
post-down brctl delbr br0

4) Configure /etc/hostapd/hostapd.conf
Open hostapd config file with:

sudo nano /etc/hostapd/hostapd.conf

Add the following lines to hostapd.conf (set SSID and password of your choice)

WITHOUT AUTHENTICATION  USE

interface=wlan0
ssid=emonPi
driver=rtl871xdrv
hw_mode=g
channel=6
auth_algs=1
wmm_enabled=0

WITH_AUTENTICATION USE

interface=wlan0
driver=rtl871xdrv
ssid=emonPi
hw_mode=g
channel=6
macaddr_acl=0
wmm_enabled=0
auth_algs=1
ignore_broadcast_ssid=0
wpa=2
wpa_passphrase=raspberry
wpa_key_mgmt=WPA-PSK
wpa_pairwise=TKIP
rsn_pairwise=CCMP


Manual start to test everything is working, you should see a Wifi network called 'emonPi':

$ sudo hostapd -dd /etc/hostapd/hostapd.conf


5) Configure /etc/default/hostapd

sudo nano /etc/default/hostapd

Set

DAEMON_CONF="/etc/hostapd/hostapd.conf"


6) Configure /etc/dhcp/dhcpd.conf
Open dhcpd config file:

sudo nano /etc/dhcp/dhcpd.conf

Add the following to the end of the file:

lease-file-name "/home/pi/data/dhcpd.leases";
subnet 192.168.42.0 netmask 255.255.255.0 {
        range 192.168.42.2 192.168.42.20;
        option broadcast-address 192.168.42.255;
        option routers 192.168.42.1;
        default-lease-time 600;
        max-lease-time 7200;
        option domain-name "local";
        option domain-name-servers 8.8.8.8, 8.8.4.4;
}

comment out #option domain-name "example.org";

#option domain-name-servers ns1.example.org, ns2.example.org;

uncomment

authoritative;

7) Configure /etc/default/isc-dhcp-server

sudo nano /etc/default/isc-dhcp-server 

Remove the comment from DHCPD_CONF, DHCPD_PID and then set the INTERFACES to "wlan0" (including ""), see example below:

# Defaults for isc-dhcp-server initscript
# sourced by /etc/init.d/isc-dhcp-server
# installed at /etc/default/isc-dhcp-server by the maintainer scripts
#
# This is a POSIX shell fragment
#

# Path to dhcpd's config file (default: /etc/dhcp/dhcpd.conf).
DHCPD_CONF=/etc/dhcp/dhcpd.conf

# Path to dhcpd's PID file (default: /var/run/dhcpd.pid).
DHCPD_PID=/var/run/dhcpd.pid

# Additional options to start dhcpd with.
#       Don't use options -cf or -pf here; use DHCPD_CONF/ DHCPD_PID instead
#OPTIONS=""

# On what interfaces should the DHCP server (dhcpd) serve DHCP requests?
#       Separate multiple interfaces with spaces, e.g. "eth0 eth1".
INTERFACES="wlan0"


8.) Setup NAT forwarding to bridge eth0 the wlan0 while still allowing us to access the Pi via SSH (pure network bridge does not)

To set this up automatically on boot, edit the file /etc/sysctl.conf and add the following line to the bottom of the file:

net.ipv4.ip_forward=1

Second, to enable NAT in the kernel, run the following commands:

sudo iptables -t nat -A POSTROUTING -o eth0 -j MASQUERADE
sudo iptables -A FORWARD -i eth0 -o wlan0 -m state --state RELATED,ESTABLISHED -j ACCEPT
sudo iptables -A FORWARD -i wlan0 -o eth0 -j ACCEPT


If bride is also required to eth1 (for 3G dongle) add:
sudo iptables -t nat -A POSTROUTING -o eth1 -j MASQUERADE
sudo iptables -A FORWARD -i eth1 -o wlan0 -m state --state RELATED,ESTABLISHED -j ACCEPT
sudo iptables -A FORWARD -i wlan0 -o eth1 -j ACCEPT


sudo sh -c "iptables-save > /etc/iptables.ipv4.nat"

Now edit the file /etc/network/interfaces and add the following line to the bottom of the file:

up iptables-restore < /etc/iptables.ipv4.nat # This did not work for me I had to add entry to rc.local (see below)

8) Edit /etc/rc.local

sudo nano /etc/rc.local

Add before exit 0 the following lines to tell the wlan interface to use ip address 10.0.1.1 and then start the isc-dhcp-server:

sudo iptables-restore < /etc/iptables.ipv4.nat
sudo ifconfig wlan0 192.168.42.1

sudo service isc-dhcp-server restart
sudo iptables-restore < /etc/iptables.ipv4.nat


9) Start services at boot


sudo update-rc.d isc-dhcp-server defaults
sudo update-rc.d hostapd defaults


Thats it restart your emonpi/emonbase to finish and then connect to network emonPi with password: raspberry

11) Add a Real Time Clock (RTC)
When running an emonPi in offline mode we recommend adding a hardware RTC to ensure the system time is always correct. See emonPi Wiki:


Hardware RTC


Resources 
Useful blogs, guides and forum threads that I used to work out how to set up the above:
http://www.daveconroy.com/turn-your-raspberry-pi-into-a-wifi-hotspot-with-edimax-nano-usb-ew-7811un-rtl8188cus-chipset
http://askubuntu.com/questions/140126/how-do-i-configure-a-dhcp-server
http://ubuntuforums.org/showthread.php?t=2068111
http://raspberrypi.stackexchange.com/questions/9678/static-ip-failing-for-wlan0
https://forums.opensuse.org/showthread.php/438756-DHCP-can-t-write-to-dhcpd-leases
http://elinux.org/RPI-Wireless-Hotspot
http://askubuntu.com/questions/140126/how-do-i-configure-a-dhcp-server
http://www.instructables.com/id/Raspberry-Pi-as-a-3g-Huawei-E303-wireless-Edima/?ALLSTEPS


Pulse counting with the RFM69PI and RaspberryPi EmonBase basestation

The latest version of the RFMPi Adapter board made much of the spare digital and analog IO available for use directly on the RFMPi adapter board. D3 is one of the digital inputs available and can have an interrupt attached (INT 1) which makes it useful for pulse counting.

By connecting a optical pulse sensor directly to the rfm69pi adapter board this can make a relatively low cost solution for internet connected pulse counting (or local logging to emoncms running on the raspberrypi).


Setup

1) The RJ45 connector on the optical pulse counter needs to be removed and individual wires exposed. Connect the red wire to 3.3V, the black wire to GND and the blue wire to D3:


2) To use the rfm69pi adapter with pulse counting the pulse counting firmware needs to be uploaded to the rfm69pi adapter board, the steps to upload this firmware are:
  1. SSH into your raspberrypi running the standard OpenEnergyMonitor image.
  2. Place raspberrypi in write mode:
    $ rpi-rw
  3. Stop emonhub:
    $ sudo service emonhub stop
  4. Pull in latest changes to RFM2Pi git directory:
    $ cd RFM2Pi
    $ git pull
  5. Upload pulse counting firmware:
    $ avrdude -v -c arduino -p ATMEGA328P -P /dev/ttyAMA0 -b 38400 -U flash:w:/home/pi/RFM2Pi/firmware/dev/RFM69CW_RF12_Demo_ATmega328_Pulse/RFM69CW_RF12_Demo_ATmega328_Pulse.cpp.hex
  6. Start emonhub:
    $ sudo service emonhub start
Next login to the local emoncms installation on the raspberrypi and navigate to the emonhub.conf editor. Add the following node definition in the nodes section of emonhub.conf:

[[15]]
    nodename = rfmpi_pulse
    firmware = RFM69CW_RF12_Demo_ATmega328_Pulse
    hardware = rfm69pi
    [[[rx]]]
       names = power,count
       datacodes = h,L
       scales = 1,1
       units = W,Wh 


The pulse count is accumulated on the rfm69pi until the rfm69pi is reset either by an outage or by turning off and on the power.

To record the total accumulated pulse count in emoncms use the wh_accumulator input process which detects resets continuing the total pulse count accumulation from the last value before the reset.

At Watt Cost? A review of the emonPi Raspberry Pi based energy monitor

At Watt Cost ?

A review of the emonPi, a Raspberry Pi based energy monitoring system developed by OpenEnergyMonitor, by Lionel Smith :


Measurement is the first step that leads to control and eventually to improvement. If you can’t measure something, you can’t understand it. If you can’t understand it, you can’t control it. If you can’t control it, you can’t improve it.”
― H. James Harrington
emoncms_solarPV_laptop_mobile.png
Do we know how much electricity can be saved by using low energy lighting such as LED's or how much electricity is saved by turning off lighting when not in use?
Finding out how much electricity is being used by one or all of your appliances, is the first step in being able to cut down on consumption, and in doing so spend less on electricity. It goes without saying that reducing your consumption equates to doing your bit towards creating a sustainable world.
Glyn Hudson, Trystan Lea and the rest of the team at OpenEnergyMonitor.org have developed some monitoring technology to help us understand and optimise our energy consumption and generation. This allows us to approach the problem of energy consumption in a logical and informed way.
The Raspberry Pi isn't great at measuring analogue voltages, so various Arduino based measurement boards have been developed which process and digitise the inputs and transfer them to the Pi.
In early 2014 an idea was born to create a shield which plugged directly onto a Raspberry Pi to make a single unit energy monitoring solution, primarily aimed at domestic users. A whole bunch of discussions and a fair amount of blood, sweat and tears culminated in a Kickstarter campaign which raised £24,723 to help bring the project to life
This piece of kit is dubbed the emonPi, which is a Raspberry Pi based, open-source, web-connected, energy & environmental monitor. This unit gives you the ability to measure home energy, solar PV, heatpump generation and temperature.
emonPi_MyElectric_Daffs.JPG
Everything on the site is fully open-source, which means you are free to tinker and improve to suit your needs. There is a very active community so help is readily available.
Aside from the obvious current and voltage values, temperature and humidity can also be measured by adding the appropriate nodes. All this information is then formatted on the Pi and either stored locally or uploaded via an Internet connection to a hosted application called EmonCMS.
Once you've built up some data, various visualisations can be applied to create some really informative graphs.

Emoncms MyElectric and SolarPV Dashboards
The emonPi is available in both kit form or as a complete unit. Complete units are housed in a professional looking case sourced from Lincoln Binns. Even if you can’t resist the urge to experiment and order your system in kit form, it is highly recommended that you order the aluminium case to house the finished unit in. Aside from protecting everything inside, the case really gives the unit a polished, professional look.
Inside the case you will find a standard Raspberry Pi 2, the GPIO serial connected Arduino measurement shield and an I2C connected 2 x 16-character display.
Emonpibare (1).png
The unit contains built in 433Mhz low power RF which is used for communicating with its external nodes. These nodes can be used to add additional power readings (emonTx) or remote temperature and humidity (emonTH) .
Fire up the system with a LAN cable plugged in and the on board display conveniently displays its IP address. Punch that into your favourite browser ( on a PC in the same LAN ) and you get to the login page. Once logged in, you are able to setup the WiFi if you have added an external USB WiFi adapter.
The built in 16 x 2 display will also confirm the status of connected devices. In order to measure temperature, an optional DS18B20 temperature sensor needs to be connected. The emonPi can talk to multiple (up to 6) of these sensors as they are individually addressable.
Power can be measured using a clip-on CT current sensor and a 9VAC reference supply. You can cheat and omit the 9VAC supply input resulting in the AC voltage being fixed in the software, but then you are not reading true Real Power or Power Factor, so this is not recommended. If measuring solar PV two clip-on CT sensors are required and the 9VAC voltage input is essential as it's required to tell the unit if you generating or consuming power. The second CT can be used to isolate a particular load and see how much that draws. As an example CT 1 could be measuring the total of your house while CT 2 could tell you how much just your water heater or stove uses.
Another method to measure power is to use an optical pulse counter sensor that picks up the LED flashes generated by most modern electricity and gas meters.
Being able to visualise the power used by your appliances gives a whole new insight into the power needed to run them. The author used the system to evaluate the claims made by the supplier of a hot water boiler control unit that only allows the boiler to heat the water 3 times a day based on your predicted usage. Using the emonPi and Emoncms system it was easy to see exactly how much saving was achieved after installing the control unit.
The emonPi is a fantastic piece of kit and well worth having if you would like to contribute towards a greener future.


Weblinks for more information:


Safety Warning: Interfacing with mains voltages can be potentially lethal. If you are not competent, or not sure of what you are doing rather seek the assistance of a qualified professional.


Optical pulse counting with the EmonTH


In addition to temperature and humidity sensing the EmonTH has a digital input (with interrupt) that can be used for pulse counting.

This can be used for wired pulse counting or with the Optical LED pulse sensor.

To use the Optical LED Pulse sensor the easiest way is to remove the RJ45 connector and then strip back the black sheathing to reveal the red (3.3V power), black (GND) and blue (pulse) wires.

Connect the red wire to the 3.3V terminal, the black wire to the GND terminal and the blue wire to the terminal labelled D3 (top) or IRQ1/D3 Pulse Counting (bottom of the board).


There are two firmware examples available for the EmonTH for pulse counting, the first is for Pulse counting in addition to DHT22 Temperature + Humidity sensing or DS18B20 temperature sensing:
https://github.com/openenergymonitor/emonTH/tree/master/emonTH_DHT22_DS18B20_RFM69CW_Pulse

The second is for pulse counting only if the temperature and humidity sensing is not needed:
https://github.com/openenergymonitor/emonTH/tree/master/emonTH_pulse_lowpower

To upload these firmware examples you will need the Arduino IDE and libraries installed and a USB to serial programmer to upload the firmware to the EmonTH.

The pulse count is accumulated on the EmonTH until the EmonTH is reset either by an outage or by turning off and on the power.

To record the total accumulated pulse count in emoncms use the wh_accumulator input process which detects resets continuing the total pulse count accumulation from the last value before the reset.

3CH WiFi Relay Control Board


We have recently started stocking in the shop a Three Channel WiFi Relay / Thermostat Board designed by our friend Martin Harizanov.

The board has been well designed to physically separate high voltage AC mains from the low voltage logic. The board has an optional power supply to enable the board to be powered directly from 100-240V AC. A wall-mountable plastic enclosure is included. 

The board can be used to control a heating / AC / humidifier via local control loop from on-board sensor. The unit can be programmed with a schedule and or manually controlled via web UI via WIFI. Sensor data and relay status can be posted to Emoncms for logging and graphing. 

NOTE: The board connects to and controls high voltage, knowledge and attention is required when installing to prevent electrical shock.

Overview

The relay board is a open software/hardware multi-purpose relay board based on the ESP8266 WiFi SoC. It can control up to three AC or DC loads over the Internet using web UI or MQTT.

  • Powerd direct from 230V AC via isolated on-board PSU (optional extra) or 5V DC via micro USB
  • Built-in web server with mobile device friendly UI and HTTP API to control the relays
  • Thermostat function with weekly scheduling
  • Manual relay control via the UI
  • NTP for network time and scheduling functionality
  • Web server settings, including HTTP port and basic HTTP authentication setup
  • Broadcast relay/sensor data using HTTP GET to services like ThingSpeak or Emoncms
    • Integration with ThingSpeak for charting/analytics visualization
  • Temperature sensor support (one of them, not both at the same time) - (optional extra)
    • DS18B20 one-wire temperature: supports multiple sensors
    • DHT22 (AM2302) Humidity & Temperature

Shop:

The relay board can now be purchased direct from our shop: http://shop.openenergymonitor.com/three-channel-wifi-relay-thermostat/

Documentation & Set-up: 

Full technical details and set-up guide are available on Martin's Wiki: https://harizanov.com/wiki/wiki-home/three-channel-wifi-relaythermostat-board/


Overview demo of the board in action by Paul Reed: 


Posting status & sensor readings to Emoncms


Understanding zero carbon energy systems: Energy storage (part 1)

The last zero carbon energy model example in the series investigating the matching between different energy demands and a variable renewable supply reached 89% supply/demand matching with a mixture of solar and wind supply, traditional electricity demand, space heating with heatpumps, electric vehicles with smart charging and two small stores one 7 kWh li-ion store and one 10 kWh heatstore.

Blog post: Open source hourly zero carbon energy model, combining traditional electric, heating and electric vehicle demand.

How do we achieve that final 10% of supply/demand matching? Is it possible to just scale up the li-ion storage or do we need something else? What is the nature of that final unmet demand and the final storage requirement?

One of the good things about having the model written as a program rather than spreadsheet is that its really easy to run the model iteratively for different input values, you can quickly go through hundreds of model runs. You don’t need to manually run the model for each value.

The following graph shows how the percentage of supply/demand matching increases as the storage size increases. The python source code for the model used to produce this can be found here: https://github.com/TrystanLea/zcem/blob/master/python/storagerequirements.py

In order to capture all of the storage requirement in this analysis the heatstore was removed from the last model and the EV charging was set to a constant charge profile rather than smart charging. This configuration achieves 78.3% supply/demand matching with no storage, an unmet electricity demand of 13,628 kWh over 10 years out of a total of 62,771 kWh.

% Supply/demand matching vs storage size in kWh:
We can see clearly that the degree of supply/demand matching increases very quickly as we add the first kWh's of storage but then the gains taper off quickly requiring orders of magnitude more storage to reach the final 5%.

The first 10% of supply/demand matching, bringing us up to 90% needs around 25 kWh of storage. The next 5% up to 95% requires an additional 120 kWh of storage. The final 5% requires 1536 kWh.

Note: see added section below for calculations of total storage capacity required if the oversupply is 20% or 30% instead of the 4% here.

The first 1.5% of the storage capacity provides 50% of the required supply/demand matching gain.

Its interesting to look at what the use of the 1680 kWh store looks like across the 10 year model period:
The store is used most over winter, where electricity demand is highest due to heatpump space heating. We can see that the winters of 2010 and 2011 where particularly cold and that the extent of the storage requirement in this model is largely driven by these successive harsh winters and a less strong summer. If the modelling had only considered 2002 to 2010 we might have under specified the storage amount needed by half which highlights the importance of modelling over as many years as possible.

Utilisation, cycling

We can see roughly that the full extent of the store is only used once in 10 years and is largely needed to cover just 3.5 months at the start of 2011. Even if the store was half its size it would only be used fully 3 times in 10 years. The extend to which the store is cycled is an important consideration in store choice, both from the perspective of wear and financial payback.

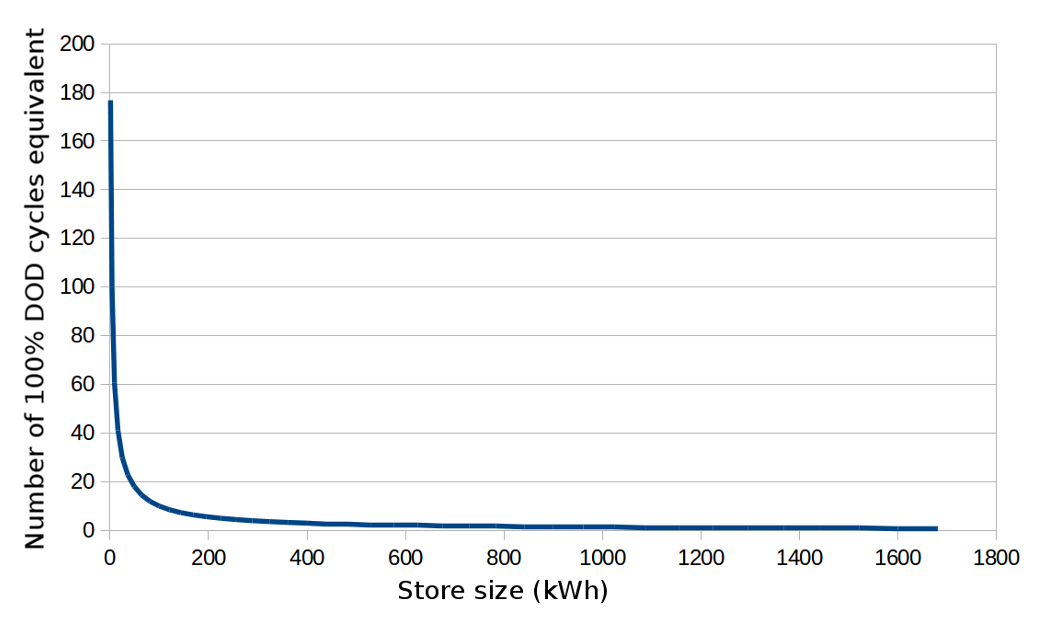
The following graph charts annual cycle requirements vs storage size, highlighting how most of the storage requirement is cycled very infrequently. A 25 kWh store delivers the equivalent charge/discharge energy of 30 full cycles a year, 100% depth of discharge (DOD). The next 120 kWh would only be cycled 7.3 times a year. A 625 kWh store would only be cycled twice in a year and the full 1680 kWh store only 0.8 times a year.

Cycles per year vs store size:
The above gives us an initial degree of insight into the nature of the storage requirements and how reaching the final 10% of supply/demand matching requires magnitude more storage than the first 10%.

Its important to note that the results above are for a model based on uk climate and weather, it would be worth repeating this kind of modelling for warmer countries where air conditioning that matched solar pv generation was a large component of demand rather than winter heating.

The next blog post will look at some of the different storage technologies available and how they are suitable for different segments of the overall storage requirement.

Reducing storage requirements by oversupply 
Following the conversation with Dominic Zapman here https://twitter.com/Zapaman/status/627806828865409024, I decided to re-run the model with a higher degree of oversupply - nearer the oversupply level used by ZeroCarbonBritain. The results above are for an oversupply of 4% with 65391 kWh supplied over 10 years for a demand of 62771 kWh. A 1680 kWh store is 27% of the annual demand.

If we re-run the model with an oversupply of 20%, 100% supply/demand matching is reached with a 676 kWh store, 11% of annual demand.

If the oversupply is 30%, the storage requirement is reduced to 484 kWh, 8% of annual demand.

The ZeroCarbonBritain model exports 165 TWh out of the 738 TWh generated which is an oversupply of 22%. A further 180 TWh is used to generate synthetic fuels including power to gas methane storage. A high percentage of this demand will also be oversupply. The long term power to gas storage capacity in ZCB is 60 TWh, delivering on average 14 TWh/year of backup supply covering about 402 TWh of final demand excluding exports. Delivered backup is 3.5% of final demand.