Interpreting Emoncms Dashboards
The emonPi / emonTx standard install is designed to monitor whole house power consumption. An excellent learning exercise that we recommend everyone undertake soon after installing a whole house energy monitor is to turn off every appliance in the house then slowly turn on each appliance keeping a close eye on the real-time Emoncms dashboard. Walking around the house using a handheld mobile device to display the Emoncms dashboard works great for this. For fastest response we recommend connecting to the local Emoncms running locally on the emonBase / emonPi which will update ever 5s (emonPi default) or 10s (emonTx default).
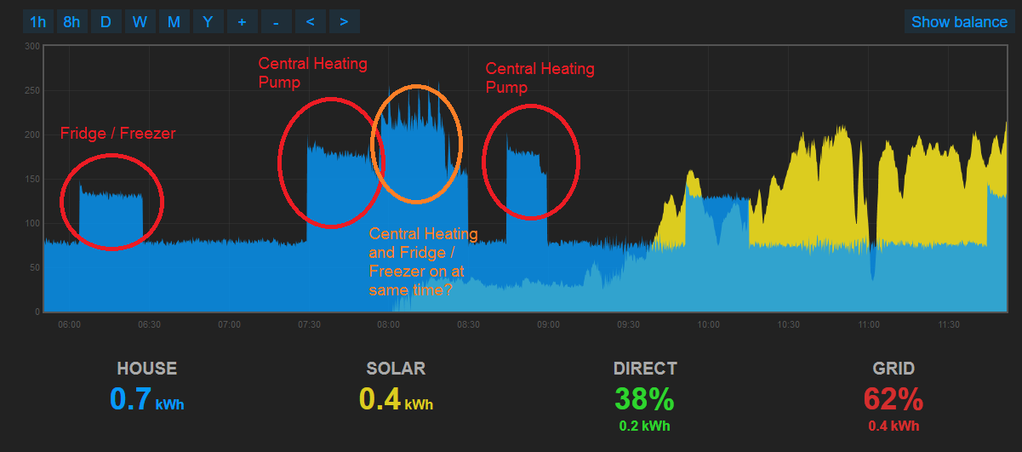
After this exercise you should have a good idea what the trace signature of each of your appliances looks like on the graph. The easiest to identify are the large power consumers e.g kettle 3kW spike and shower 8kW spike. However with a bit of observation it's possible to identify subtler power signatures. Here's an excellent example by posted by @Zapaman showing a Solar PV dashboard annotated to identify his fridge / freezer and central heating pump running over night. It's great to see the solar PV kick in providing more then the demand when the sun hits the panels in the morning :-)
To engage in discussion regarding this post, please post on our Community Forum.