Blog
OpenEnergyMonitor

Hall effect sensor circuit diagram

The circuit is an inverting amplifier circuit. The 100k pot level shifts the input signal. It can be set so that the output lies within the arduino's 0 to 5V input range. The 1k pot sets the amplification factor. By varying both pot's it is possible to set the current measurement range of the circuit. Note the output is inverted so that when the current increases the signal input to the arduino decreases from 5V to 0V.


Experiments with a hall effect current sensor

Thought Id have a go at using a hall effect sensor to measure current. A hall effect sensor can measure DC and AC current, Ive had a go at the DC and it seems to work quite nicely, its also quite a bit cheaper than the other DC current measuring method I detail here, which is always good!

Here's a pic of the setup:


I bought the hall sensor from farnell here.

It requires a supply voltage of between 6 and 12. Its output is centred around Vcc/2. The output voltage increases about 50mV per Amp when the supply voltage is 12V. When measuring DC current the output looks like this:
0.0A - 6.0V
1.0A - 6.05V
2.0A - 6.10V
...

I've used an inverting amplifier to invert the signal about a set voltage so that the voltage going to the Arduino's analog in is between 0 and 5V. I will upload the circuit diagram and further details soon when I get a chance.

So far it looks like a promising method.

OpenCO2Monitor collaboration

A couple of days ago I was contacted by Ronic Concepcion and Ymreb Momville from the University Southeastern Philippines who are undertaking a technical research project called OpenCO2Monitor as a part of their BS Information Technology degrees.

Their project will be a collaboration with this project using the Mains AC:Non-invasive method of energy monitoring to supply energy consumption information to their software.

From their blog: http://openco2monitor.exofire.net
"OpenCO2Monitor is an open source software which is capable of monitoring CO2 emissions on a house/building. When the emitted CO2 reaches danger levels, the software will automatically sound an alarm and show a message dialog on the computer screen tell the user what to do.

OpenCO2Monitor is not only capable of monitoring CO2 levels but also monitoring the electric energy consumption of a house/building. It is also capable of showing your current monthly bill based on the Davao Light and Power Company generation charge per kilowatt hour.

OpenCO2Monitor also shows how many number of full grown trees a house/building should have in its surroundings to offset its CO2 Emissions. It also displays the house/building’s current contribution to temperature rise.

OpenCO2Monitor uses the Mains AC:Non-invasive method from OpenEnergyMonitor.org to read the Kwh Usage of a house/building."
All really useful information that aims to help the user to "save money and energy while lessening their contribution to greenhouse gasses."

36 hours of house electrical energy use monitoring

Here are some KST graphical outputs of whole house electrical energy use over about 36 hours using the non-invasive method.

The large peaks is water heating. The small ones may be the fridge switching on and off.


zoomed in a bit.. a few hours:


Im quite happy with this method now, its nice, simple and safe.

Measuring DC electrical energy production from micro-renewables

Just finished writing up a page about measuring DC electrical energy production from micro-renewables. I built is for measuring the output of the wind turbine. Seems to work quite well although I need to do a bit more work on calibration.


Here's a video of it all working, sorry about the rushed and blurry video taking...


Monitoring the output of the wind turbine. from Trystan Lea on Vimeo.


Measuring AC mains energy use the non-invasive current transformer method - part 2

Over the last few weeks I have been working on measuring AC mains energy use using the non-invasive current transformer method. I've updated the website with a page about what I've done and how it works here (there's still some work to be done on the page, but most of the info is there now).

Measuring energy use in a power strip above- but is just as easy to measure whole house electrical energy use by cliping the sensor to the mains input to the house.


Update on progress and a revised aim

First an update on what I've been working on and where I hope to go next.

Over the last few weeks I have been working on monitoring mains AC electricity energy use with the non invasive current transformer method rather than the invasive current sensing resistor method. In my previous post on the current transformer (CT) method I made two errors first the circuit I used was over complicated and secondly the efergy energy monitor seems to be able to estimate real power. Even though the CT method only measures current, I tried to see if it was possible to infer the voltage waveform from the current waveform producing a close estimate of the real power, It seems to have worked quite well. I will upload the details of what I have done soon.

I have also been working on DC energy monitoring for the wind turbine. I built the circuit that I talked about in the previous post. I however managed to blow one of the amps on the LT1495 chip and there seems to be an offset on the other amp which may be due to having blown one side. Id like to find a cheaper amp to replace the LT1495, maybe sacrificing a little on accuracy.

For the next two weeks the wind turbine is going up at two local festivals here in North Wales (Celtic camp and the National Eisteddfod). If your in the area feel free to drop by.

After the festivals I hope to have a look at monitoring the energy captured by the hot water solar panel we have here on our house, at the moment were not sure if it is working properly, it doesn't seem to be heating much water. However its hard to tell; the controller gives the current temperatures of the tank and panel, it would be useful to have graphs of the temperatures over several days and if a flow meter is installed it is possible to measure kWh of heat captured. Hopefully with better information it would be easier to see how well the system is working. It would be great to have a bit of software that analysed the data from the system, compared it to ideal site data and then be able to tell you something like “your system is working at 80% of potential”

All the above applications can all share the same software and similar electronics based on the Arduino. Once one is built, your have a lot of what you need for the others.

Further along the line it could be interesting to investigate possibilities for predicting how much energy it is possible to capture from a wind turbine or a hydro turbine before it is installed at a site using an arduino connected to an anemometer for wind or a river flow meter for hydro. I have also been doing some work with Suneil on trying to characterise how well the generator we built for the wind turbine works. With some detailed data and analysis it might be possible to identify possible improvements. Both the energy prediction and generator development could again share much of the same electronics, software and knowledge required for the energy use and energy capture parts of the project. And finally I would like to look at Internet connectivity, it would be really great to be able to check up on how say the wind turbine is doing from anyware in the world.

And so for the project to encompass all of the above:

"This is a project to develop and build open source energy monitoring and analysis tools for energy efficiency and distributed renewable micro generation."

The project is then divided into 6 areas:

Energy Use
Mains AC electricity and DC.

Energy Capture
Wind turbine, hot water solar, hydro etc.

Energy Prediction
Wind speeds, stream flow...

Energy Technology Development
Tools for the development and building stage rather than the use stage.

Data graphing and analysis and storage.
Using free and open source software

Sharing data with the world
Internet connectivity.

Hopefully this better reflects the direction of the work and will hopefully be a more useful collection of tools for anyone interested.

I will be updating the website soon with the recent work and to reflect the revised aim.

Any comments on the above would be great. Thanks for reading!

Software improvement and examples

I have made a start on rewriting parts of the software to make the code a bit more object orientated and easier to use. I was finding that every time I needed to adapt the software for a different use it was a bit messy.

In the process of doing a the re-write I will be adding examples of each significant part of the whole program working independently.

Have a look on the software page for part 01 - Reading data from the Arduino and conversion of the data to a useful form.

A start on DC current sensing

Now that both the North Wales and Cardiff EWB wind turbines have been built, it would be good to have some sort of laptop based graphical output of the power produced from the wind turbine when its taken up to a site for testing and so I have been looking at how to modify the OpenEnergyMonitor design to do that.

The wind turbine creates 12V DC electricity. It can produce up to around 500W of power, about 40Amps.

I have decided to go along the invasive current sensing route with a sense resistor (also known as a shunt). When dealing with such high currents the sense resistor needs to be quite beefy! Here's a picture of my test setup using a computer power supply to simulate the wind turbine and a 50W halogen as a load. The large block in the middle is the sense resistor.

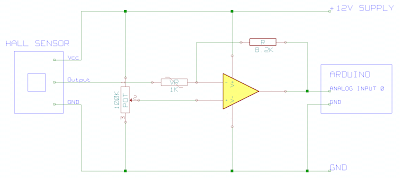
I'm now on the stage of getting parts for a circuit that will allow the Arduino to read the voltage across the sense resistor.

I came across quite a lot of good circuit examples and advice on the linear technologies website here. Im thinking of following the battery current monitor circuit which can be found in their DC pdf. Here's the schematic:
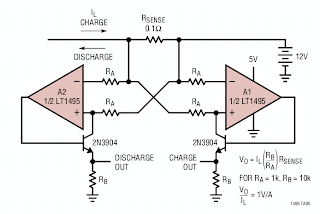
It can measure both current flowing in to the battery when the wind turbine is generating and current flowing out of the battery when there are loads connected.

I will post up the results once its built, I also need to make a load that can vary between 0 and 500W so it can be tested properly, the current plan is to make that load from a mini 12V kettle and a mixture of 50W 20W and 10W halogen bulbs all of which can be turned on and off from the Arduino. Should be fun!

If anyone has any experience with renewables and DC current measuring circuits I would be glad of any suggestions on any of the above.