Just finished the Xbee documentation it can be found here:
How to add an Xbee wireless link
Display documentation
USB pen data logger documentation
The USB pen drive data logger documentation is finished and can be found here:
How to add USB pen data logging
How to add USB pen data logging
Main documentation page started
Made a start on the main documentation page for the whole house energy monitor. It can be found here:
How to build a whole home energy monitor
How to build a whole home energy monitor
Measurement board documentation
Just finished the measurement board documentation it can be found here:
http://openenergymonitor.org/emon/node/42
The measurement board contains the voltage and current measurement electronics and the power electronics for providing power to the arduino in the main unit.
http://openenergymonitor.org/emon/node/42
The measurement board contains the voltage and current measurement electronics and the power electronics for providing power to the arduino in the main unit.
Finished, working, functional home energy monitor!
I have spent some time over the last couple of weeks working on getting a finished energy monitor for the house together and installed in a more permanent way. I managed to finished the build yesterday and it's now working away logging energy consumption data, giving some informative readouts and nice looking graphs :)
I decided on having a real time display that can be mounted in some ware visible with a cable running to the main unit that holds the sensor electronics situated near were the mains comes in to the house. The main unit also has a USB pen data logger in it to store detailed data. I also wanted to send data to be graphed on the net and so I have another box near my router that has a second arduino and an arduino ethernet shield in it. The ethernet box is connected to the main unit with a wireless xbee connection.
Its quite a complex setup and a bit pricey but I wanted to learn about each element and since I had bought a couple of arduinos, xbee's etc I thought I'd through it all together and make something with lots of crazy and useful things going on in it...
Here are some pics of the setup:
 The display unit consisting of 4 large green led 7 segments. On the right is a 6 mode – mode chooser so that you can select by turning the potentiometer (bottom – right) whether the display shows real power, apparent power, power factor, RMS Voltage, RMS Current, frequency or cumulative kWh used. The display is connected to the main unit by a cable that goes through the wall at the back of the display.
 The main unit is the small box in the far left of pic with the white CT sensor wire crossing the shelf over to the sensor clipped on to the main mains wire on the right.
 The ethernet unit connected to the router, the small box on top of the larger box houses the xbee and can be detached if one wanted a wire connection instead.
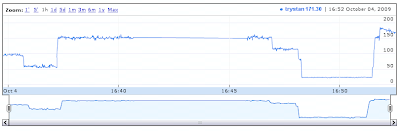
 A screenshot of the web based graphing that can be seen live here.
Graphing is done using flot – a very nice piece of software.
I'd like to thank John from jarv.org for his work and help on logging using the ethernet board although he is using open flash charts much of the implementation is very similar.
For more pictures of the setup check out the picassa album here.
Over the next two weeks I hope to document it the setup. I hope to manage a section every couple of days in the order of the features below:
Main Features
Block diagram of the setup:

I decided on having a real time display that can be mounted in some ware visible with a cable running to the main unit that holds the sensor electronics situated near were the mains comes in to the house. The main unit also has a USB pen data logger in it to store detailed data. I also wanted to send data to be graphed on the net and so I have another box near my router that has a second arduino and an arduino ethernet shield in it. The ethernet box is connected to the main unit with a wireless xbee connection.
Its quite a complex setup and a bit pricey but I wanted to learn about each element and since I had bought a couple of arduinos, xbee's etc I thought I'd through it all together and make something with lots of crazy and useful things going on in it...
Here are some pics of the setup:
 The display unit consisting of 4 large green led 7 segments. On the right is a 6 mode – mode chooser so that you can select by turning the potentiometer (bottom – right) whether the display shows real power, apparent power, power factor, RMS Voltage, RMS Current, frequency or cumulative kWh used. The display is connected to the main unit by a cable that goes through the wall at the back of the display.
 The main unit is the small box in the far left of pic with the white CT sensor wire crossing the shelf over to the sensor clipped on to the main mains wire on the right.
 The ethernet unit connected to the router, the small box on top of the larger box houses the xbee and can be detached if one wanted a wire connection instead.
 A screenshot of the web based graphing that can be seen live here.
Graphing is done using flot – a very nice piece of software.
I'd like to thank John from jarv.org for his work and help on logging using the ethernet board although he is using open flash charts much of the implementation is very similar.
For more pictures of the setup check out the picassa album here.
Over the next two weeks I hope to document it the setup. I hope to manage a section every couple of days in the order of the features below:
Main Features
- Voltage measurement with step down AC to AC adapter,
- Current measurement with CT sensor.
- Power for sensor board provided with same AC to AC adapter used for voltage measurement.
- Calculation of Real power, Apparent power, power factor, RMS voltage, RMS current, frequency, cumulative kWh.
- Display unit consisting of large green 7 segment display, 6 mode – mode chooser and red/green led indicator to indicate when grid is below and above 50Hz.
- USB pen data logging using VDIP1 board
- Xbee wireless link from sensor unit to the Ethernet unit.
- Ethernet board for logging and graphing on internet.
- Flot based graphing on website.
Block diagram of the setup:

Micro Maker Fair Wales
Myself and Suneil will be exhibiting the energy monitor and wind turbine at Micro Maker Fair Wales in Chapter arts center in Cardiff tomorrow and Saturday 11am - 4pm. The Maker Fair is a part of the may you live in interesting times festival, read more about it here:
http://www.mayyouliveininterestingtimes.org.uk/makersfaire.html
Come along if your in the area!
http://www.mayyouliveininterestingtimes.org.uk/makersfaire.html
Come along if your in the area!
7 segment display and more internet stuff
Finally got the 7 segment display I've been meaning to build for a while built, its great being able to see power usage without having to have the computer on and the big green digits are really nice and clear.
Here's a video of it in action with a bit on pachube and appspot at the end:
I using a MAX7221CNG driver chip with four 1" green digits, following the tutorial (a very good tutorial I may add!) on the arduino site by here:
http://www.arduino.cc/playground/Main/MAX72XXHardware?action=diff
Here's the arduino sketch I used in the above video:
http://openenergymonitor.org/emon/sites/default/files/CTDisplaySerial.pde
and after playing about with ladyada's python code from tweet-a-watt Im now using python on the computer side.
Here's the python script that outputs values to terminal, a file, pachube and google appspot:
http://openenergymonitor.org/emon/sites/default/files/main9oct.tar.gz
Feels like things are coming together :)
Ive got an asus rooter on order and an arduino ethernet board to play about with so hopefully will not need the computer to be on all the time for data logging soon. Id also like to have a look at enclosures for the display to make things look nice.
Here's a video of it in action with a bit on pachube and appspot at the end:
CT sensor with Display and Internet from Trystan Lea on Vimeo.
I using a MAX7221CNG driver chip with four 1" green digits, following the tutorial (a very good tutorial I may add!) on the arduino site by here:
http://www.arduino.cc/playground/Main/MAX72XXHardware?action=diff
Here's the arduino sketch I used in the above video:
http://openenergymonitor.org/emon/sites/default/files/CTDisplaySerial.pde
and after playing about with ladyada's python code from tweet-a-watt Im now using python on the computer side.
Here's the python script that outputs values to terminal, a file, pachube and google appspot:
http://openenergymonitor.org/emon/sites/default/files/main9oct.tar.gz
Feels like things are coming together :)
Ive got an asus rooter on order and an arduino ethernet board to play about with so hopefully will not need the computer to be on all the time for data logging soon. Id also like to have a look at enclosures for the display to make things look nice.
Pachube
Got a pachube feed going. See the gadget on the side ->
To check out my pachube feed page in more detail:
http://www.pachube.com/feeds/2801
From pachube's website:
"Pachube is a web service available at http://www.pachube.com that enables you to store, share & discover realtime sensor, energy and environment data from objects, devices & buildings around the world. Pachube is a convenient, secure & scalable platform that helps you connect to & build the 'internet of things'."
Internet connectivity and xbee wireless - what a day!
Decided to have a go at getting my xbee's to work this morning so that data can be sent wirelessly from the sensors to the computer.
Followed ladyada's tutorial here:
http://www.ladyada.net/make/xbee/point2point.html
and it works!
I then thought id have a go at following her tweet-a-watt internet connectivity tutorial using google appspot and visualizations here:
http://www.ladyada.net/make/tweetawatt/database.html
http://www.ladyada.net/make/tweetawatt/graph.html
also works! great tutorials!
Here's a couple of minutes of realpower measurements graphed with google visualizations:
http://openenergymonitor.appspot.com/graph
and the last 10 power values:
http://openenergymonitor.appspot.com/
I had to modify a couple of things to get it all to work with the Mains AC: non-invasive method, I will post up a how to and source code soon as I can.
Next id like to try to use the Asus wifi router to remove the computer altogether that ladyada details here:
http://www.ladyada.net/make/tweetawatt/expand.html
and Ive got components for a 7 segment display on order.