Blog
OpenEnergyMonitor


PCB Experiments

Trystan and I have spend an enjoyable afternoon experimenting with making our own PCBs. From knowing nothing about the process in a few hours we had made our first PCB!

Trystan on Quality Control

The finished Etherent Arduino board drilled and ready for population 
For more details see: http://openenergymonitor.org/emon/node/109


Energy monitoring at the CAT - part 4

continues from part 3

Next Steps and the PV Lab project

With the pulse output kwh meters on all the renewable generators and un-interruptible loads connected up to the display server. The next step on the monitoring data acquisition side is to get detailed data from the 20kW PV roof array.

The PV Lab project

This is quite a big project with a lot of different measurements being made including energy measurements on the DC outputs of the panels and AC energy measurements on the outputs of 6 inverters and to research the effect of panel temperature on performance the temperature at multiple points under the array and the wind speed over the array.

Thankfully Glyn Hudson a good friend of mine, who has just graduated from doing electronic engineering at Warwick university is working with me on this and Suneil is also just about to join us this coming week, so we will have a good team on it!

Last week we spent quite a bit of time doing some further development on arduino based pulse counting, using low level port manipulation to read from multiple digital inputs at the same time and also much faster. We are just writing up about that at the moment.

Microgrid display next steps
We are also hoping to develop the public display software further. We want to make it easy to use, simple to setup and flexible enough to be used for home scale energy visualization to CAT scale energy visualisation. A downloadable energy monitoring content management system, like wordpress or drupal say but for energy... more to come on this soon

Thanks for reading the update!

Energy monitoring at the Center for Alternative Technology - part 3

continuing from part 2:

Monitoring hardware to public display database interface

Another aspect of the project that has been interesting and I have learned quite a bit from has been connecting the different monitoring hardware up to the display database, We are doing this via three routes:

1) Direct access to the SMA Inverters webbox via a cleaver bit of code Carlos has written. Carlos has kindly documented his work and put it up on the website here, have a look: http://openenergymonitor.org/emon/node/89

2) Via a JSON string fetched across the network from a script on the proprietary SCADA pulse counting system. With the JSON string being decoded and the data being inserted in the database via the method documented here: http://openenergymonitor.org/emon/node/88

3) For the pulse output meters: total grid import, chp generation and backup diesel generator that are located on a different part of site were there was no existing pulse counting hardware: I used an arduino to read the pulses and an ethernet shield to send a JSON string with the power and energy data to the public display server. I have documented the Arduino pulse counting here http://openenergymonitor.org/emon/node/79

Finding out about JSON strings was really useful. A JSON string is a string structure that allows you to send a variable key along with its value. It is possible to use this key to automatically register new devices by checking if the device already exists in the database with the same key and also send data from multiple devices in no particular order to the same script on the server.

Learning about and using pulse output kwh meters has also been very interesting. It is a nice way of monitoring large systems and there are pulse output meters for all sorts of measurement applications: water, gas etc. Many smart meters are pulse output meters, if they dont have the wired pulse output they probably have the flashing led output that you can bolt a sensor on to as many people are doing.

part 4: next steps and the PV lab project...

Energy monitoring at the Center for Alternative Technology - part 2

continuing from part 1:

The micro grid display

Enter Carlos!

Carlos has been developing the public energy display for the microgrid, so that visitors at CAT can see exactly how much energy all the renewable generators are producing and how much CAT is using. The display has a load of good features: graphs, statistics, comparison bars and other relevant info. Here's a screen of the total generation page of his display:

The display is programmed in php, and the interface between the database and the display is done via a script that creates an xml file and jpg graphs from data in the database and then a second script that fetches the jpgs and xml file and displays the output.

Carlos is very much an open source fan an we have been having some great discussions about were this open source energy monitoring and energy visualisation displays could go, we have some exiting plans in the works that I will come back to soon...

First a bit more about the current system in part 3...


Energy monitoring at the Center for Alternative Technology - part 1

Over the last two months I have been doing a project at the Center for Alternative Technology (CAT). I have been working on the monitoring system for the microgrid they have there, its has been and continues to be a really fascinating and enjoyable project.

CAT is one of Europe's leading sustainability center's, it is a university, a visitors center a pulisher of books, reports such as zerocarbonbritain and a place were practical solutions, sustainable technologies are tried out, tested and demonstrated.


For a sustainable technology enthusiast like myself it is a great place to be. There is a lot of green technology there! A very large PV roof, several hydro turbines, wind turbines, woodchip and pellet boilers, CHP plant, heat pumps and many others I'm sure I have missed. The electrical generation technologies are all connected up to a microgrid and there is a heat main on the heating side of things.

The microgrid is really interesting, Jaise Kuriakose is the electrical engineer for the microgrid and has designed the system. I recommend having a read of the follwoing articles, blog posts and Jaise's presentation about the microgrid:


Monitoring
On the monitoring side there are pulse output kwh meters on all the renewable generators and non interruptible mains loads. As the microgrid is a recent addition, when I started these meters were not connected up to a data acquisition/logging system.

I spent the first couple of weeks connecting up these pulse output meters to the scada system that was in place for the previous monitoring setup and then configuring the scada system for the new metering setup.

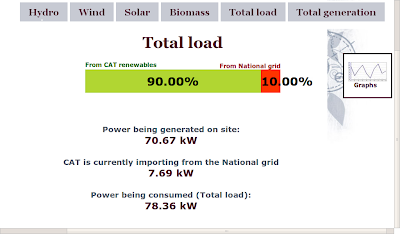
The immediate aim of this was to get data to the microgrid public energy display, which I will write about next in part 2.....