Energy monitoring at the Center for Alternative Technology - part 2
continuing from part 1:
Enter Carlos!
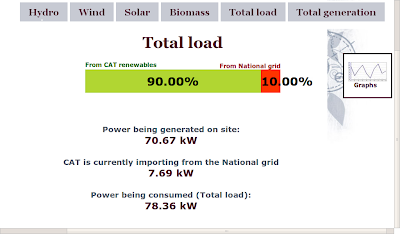
Carlos has been developing the public energy display for the microgrid, so that visitors at CAT can see exactly how much energy all the renewable generators are producing and how much CAT is using. The display has a load of good features: graphs, statistics, comparison bars and other relevant info. Here's a screen of the total generation page of his display:
The display is programmed in php, and the interface between the database and the display is done via a script that creates an xml file and jpg graphs from data in the database and then a second script that fetches the jpgs and xml file and displays the output.
Carlos is very much an open source fan an we have been having some great discussions about were this open source energy monitoring and energy visualisation displays could go, we have some exiting plans in the works that I will come back to soon...
First a bit more about the current system in part 3...