Heat pump Testing: Initial results
Test period: 17th of October to 7th of February (113.3 days)
Electricity input: 413 kWh (3.6 kWh/d)
Heat output: 1405 kWh (12.4 kWh/d)
COP: 3.4
Electricity input includes: heat pump compressor, heat pump controller and circulation pump.
In late October last year I installed with John Cantors help an air source heat pump at home, I currently live in a small cottage in Snowdonia, North Wales and after several winters of heating with a wood stove and direct electrical fan heaters, its been great having a warm place with much reduced electrical input requirement and wood consumption and its given me a good opportunity to test the technology in order to understand and confirm how well it works, albeit in a building which is far from low energy in terms of building fabric performance.
Here is a photo of the cottage which gives a good idea of the kind of building it is; for a detailed look at the space heating energy requirements and building fabric see appendix. The heat pump is located at the back and is a Mitsubushi Ecodan 5kW air-to-water heat pump.

Heat pumps are a key part of zero carbon energy plans such as the ZeroCarbonBritain scenario developed by the Centre for Alternative Technology and are also highlighted in David MacKay's book Sustainable Energy without the hot air here which is a good intro. They essentially make it possible to provide heating with around 3x less renewable electrical input than would otherwise be required if direct electrical heating was used instead.
There has been quite a bit of discussion about the performance of heat pumps in real world conditions with many examples of heat pumps installed in recent years in the UK not performing as well as expected, however through my work with John on monitoring heat pump systems I'm aware that it is certainly possible to get the high COP's advertised if the system is well installed and operated correctly.
With this system installed at home I've been particularly keen to monitor it so that I could test and optimise its operation with full control of the range of operating parameters such as the flow temperature, target room temperature, heating periods, radiator zoning etc.
In order to get a good understanding of the system's performance I have been monitoring the following properties:
- Electricity input power Watts.
- Total electricity input in kWh
- Heat output power in Watts
- Total heat output in kWh
- Outside temperature
- Room temperature
- Flow temperature
- Return temperature

There's more on this here.
Schematic, board files & Firmware.
I installed a Class 2 Ampy single phase kwh meter with pulse output which I had on hand in parallel in order to confirm the electricity input measurement.
Over the period 17th of October through to the 7th of February the heat pump used 413 kWh of electric. The Kamstrup heat meter clocked up 1405 kWh of heat output in the same period giving an overall average COP of 3.4.
Carbon intensity at a COP of 3.4
Heating with mains gas burnt in a 88% efficient boiler emits ~230gCO2/kWh of delivered heat. At a grid CO2 intensity of 512gCO2/kWh and a COP of 3.4, a heat pump would emit 151gCO2/kWh providing a significant saving. During the period of the test the grid CO2 intensity has averaged significantly below this at around 318gCO2/kWh which would result in a delivered heat CO2 intensity of 94gCO2/kWh. Calculating the intensity using real-time grid intensity taking into account the use of the electricity often at peak times increases this to 98gCO2/kWh delivered heat.
Running a similar calculation with real time uk wind power output data suggests that if an amount of wind power was bought to cover the demand over the period I.e 413 kWh of wind power. Then the matching between the heat pump demand and the wind power supply would be near 35% (see section below for more detail). If only this matched amount was accounted for then this would reduce the co2 intensity to 217gCO2/kWh or 64gCO2/kWh delivered heat. Ultimately of course with a fully zero carbon energy supply balanced with backup storage such as power-to-gas as used in ZeroCarbonBritain the CO2 intensity could be zero, but the above figures suggest that even in a partially de-carbonised grid the benefits could be significant.
Heating cost at a COP of 3.4
At a COP of 3.4 the cost of the heat delivered based on a good energy 100% renewable energy tariff in north wales at 15.08p/kWh is 15.08 / 3.4 = 4.44p/kWh.
These figures so far don't strictly need a dedicated heat pump monitor, a single phase kWh meter for electricity consumption and a kamstrup multical 402 heat meter is sufficient, all that is required is to take a set of readings manually at the start and at the end of the measurement period.
Detailed monitoring
In order to get a fuller understanding of how the system is working I have also been monitoring key system temperatures including flow and return temperature to the radiator circuit, the outside temperature and room temperature. I have also been recording power input and heat output at 10s resolution, along with accumulated kwh electrical input and heat output.
The following example screenshot shows a heating period between 1:30pm and 6:30pm in the afternoon, recorded on Sunday February the 7th. The room temperature was raised from 13.3C up to 19.7C, or a mean of 18.5C. The COP was 3.54 and mean flow temperature 37.4C.
The COP performance of an ideal heat pump is given by the Carnot COP equation:
Carnot COP = (Condensing + 273) / ((Condensing+273) – (Evaporator+273))
In an air-source heat pump the condensing temperature may be around 4K higher than the flow temperature and the evaporator around 6k lower than the outside air temperature. Using monitored outside temperature data and flow temperature data its possible to calculate this theoretical Carnot efficiency. A practical heat pump only achieves around 50% of the Carnot COP.
The actual measured COP in this example agrees quite well with the theoretical Carnot COP x0.5 figure calculated using the flow and outside temperatures:

The following histograms calculated from the monitored data show typical system properties and external conditions over the monitoring period. Perhaps the two main things I learnt looking at these typical figures and having watched these over the last few months is that:
In rough terms: the flow temperature was reassuringly low. The Carnot efficiency equation highlights how important low flow temperatures are for higher heat pump COP's so it was good to see that temperatures below 40C provided the heat required which also validated to a degree my radiator specification.
My wish to experiment with lower flow temperatures and longer heating periods (for my initial radiator configuration) where limited by the minimum input power to the heat pump which is just under 500W. Dropping the flow temperature much below 35C resulted in cycling. Interestingly in low energy houses this minimum power dictates that it wouldn’t be possible to run the heat pump continuously at a low level, as 500W is 12 kWh per day electrical input, 36 kWh/d heat output at a COP of 3.0. The ZeroCarbonBritain model suggests that only 6.5 kWh/d of electrical input would be required and so a certain level of system cycling or buffering/thermal storage would be needed or smaller heat pumps?
I still have a lot to learn about the operation of the system and system design, I'd like to expand on work I started a number of years ago on dynamic building energy modelling to try and build dynamic a heat pump model that can be cross checked against the real-time data to work out if it could be possible to then predict better control strategies and verify understanding more generally.

Heat pump supply/demand matching with UK wind power
Another key question that is important address heat pump heating systems when considered in relation to the wider energy system is how well heat pump electricity demand can match renewable energy supply and from a grid stability perspective how concentrated electricity demand from heat pumps will be at peak times.
Can we design heat pump systems that provide more even, or better matched to renewable supply demand profiles? Do we need to incorporate thermal stores to shift demand to less constrained times? At what capacity? How might better control strategies be developed to automatically provide the best balance between heating in relation to occupancy, comfort, grid stability and renewable supply?
In the energy modelling work I carried out last year, based on the centre for Alternative Technologies Zero Carbon Britain model here. The model suggested that supply/demand matching levels of around 57% might be possible to achieve with annually matched wind power to heat pump demand. The model targeted an even 18C in a well insulated home, taking into account solar gains.
Carrying out a similar calculation with actual electricity consumption data from the heat pump and wind power supply from metered uk wind data suggests a supply/demand matching of 35% over the last 3 months, the building fabric and heating profile is quite different and this is matching figure for a single household as opposed to an aggregation of many households which will smooth out to a degree.
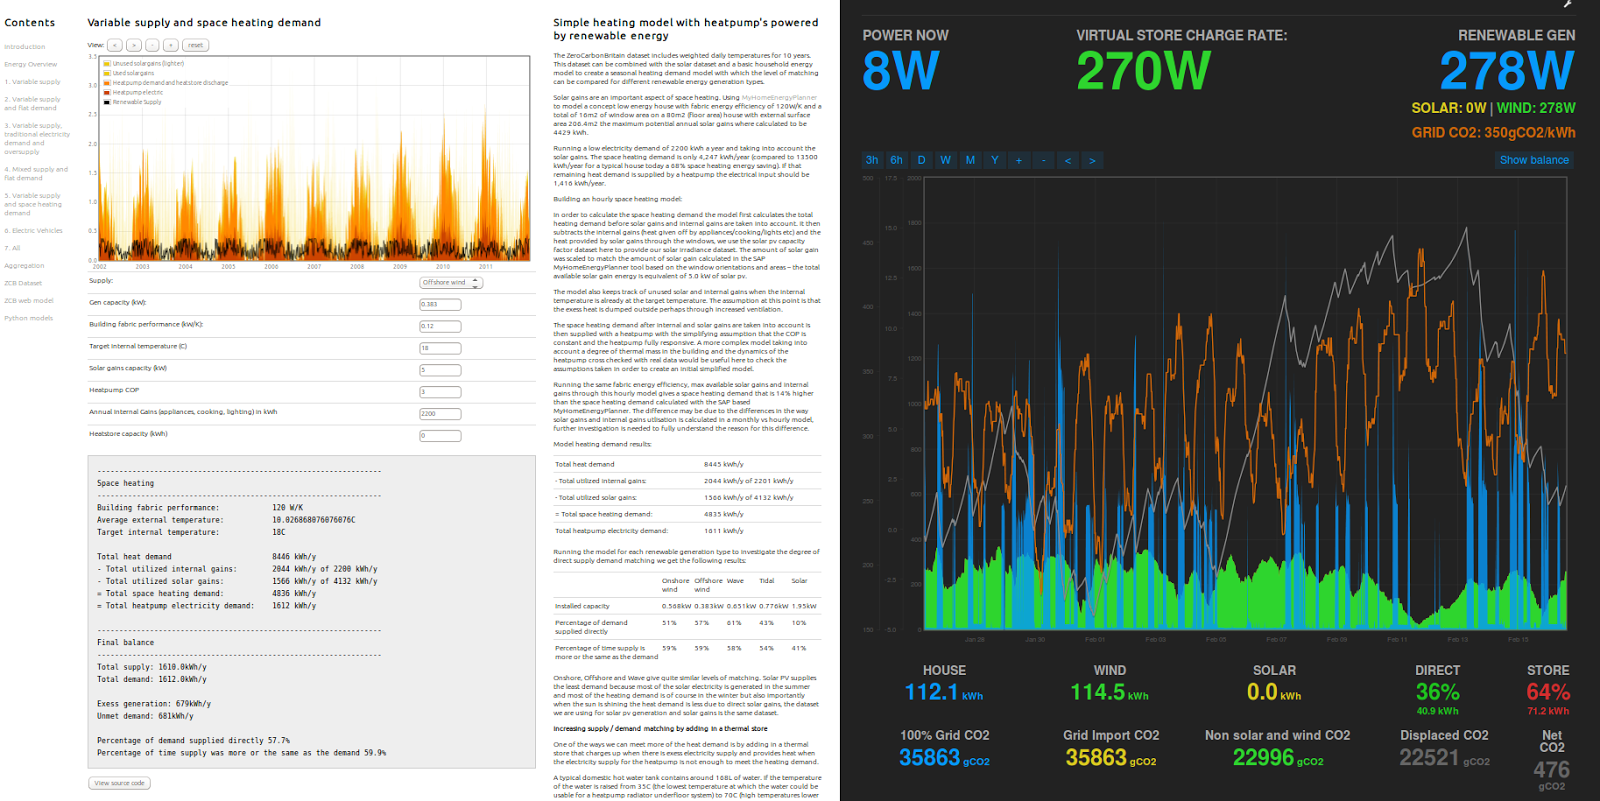 |
| Left: Space heating model, Right: "my energy" (smart grid) app available on emoncms.org |
The following graph shows my averaged heating profile calculated by running through the power feed data from the heat pump monitor and calculating the total kWh of electricity consumed at each hour of the day over the measurement period. It shows the higher morning and evening consumption quite well:
I had initially hoped to be able to run the heat pump more continuously but at a very low level. I had modelled that if it where possible to drop the flow temperature right down I could run the heat pump for longer at higher COP's without increasing energy use significantly, but I found that because my heat demand was lower than the minimum input power to the heat pump I couldn't really make use of the potentially higher COP's possible as the flow temperatures where limited by the minimum heat pump power and the size of my radiator circuit.

The initial results are encouraging with an average COP of 3.4 over the test period 17th of October to 7th of February. The estimated matching level achieved between demand and wind supply data provides a good starting point from which improvements can be measured against.
Going forward I plan to revisit work I did several years ago on dynamic building thermal performance modelling here and an initial heat pump simulation I put together at the time. Id like to see how close a relatively simple model like this correlates with actual data, with a model in good agreement it could be possible to explore what kind of control strategies might best optimise for lower energy use, increased renewable supply/demand matching and grid stability.
I'd like to learn more about the integration of thermal stores to shift demands such as the morning heating run or domestic hot water heating to times where grid co2 intensity is low and wind supply is high and trial these idea with the system at home using the latest developments on the emonpi such as openhab and nodered to control the timing of the heating runs in response to wind and grid co2 data feeds.
Appendix: Building fabric
The cottage is traditional stone construction, plaster on-hard it has 100mm of loft insulation, and secondary glazing. The main living area is on the left and has a floor area of 20.5m2, the older part on the right has a floor area of 21.04m2.
Modelling the building fabric in MyHomeEnergyPlanner the open source home energy retrofit assessment tool that I have been working on with Carbon Coop which is based on the UK's SAP model I calculated that the heat loss parameter HLP should be around 109 W/K for the main living area which is the part I'm heating in the first part of the test.
Using the SAP standard temperature of 21C and the standard heating profile the model calculated the annual space heating demand to be: 7318 kWh. At a COP of 3.0 the electric input should be 2439 kWh, or on average 6.7 kWh/d. This is 1.6x the ZeroCarbonBritain inferred target for heat pump space heating electrical input per household, for a floor area that is 4 times less which gives a picture of how lossy the building fabric is.

It would of course be possible to reduce the space heating energy requirement significantly with a whole house retrofit. If I insulated the walls with 200mm of hemp lime, floor with 150mm of insulation, increased the loft insulation to 250mm and put in better doors I should be able to achieve a heat loss parameter of 61 W/K resulting in an annual heating demand of 3903 kWh and annual heatpump electricity input of 1301 kWh (3.6 kWh/d). If I super insulated to 250mm of insulation I might be able to achieve 2.36 kWh/d. My actual use over the last few months was 3.6 kWh/d of electricity rather than the 6.7 kWh/d predicted, this is largely due to a lower average indoor temperature leading perhaps from a lower average occupancy than the figure determined from the SAP calculation in this case To engage in discussion regarding this post, please post on our Community Forum.