Multiple multigraphs
A long asked for feature for emoncms has been the ability to create multiple multigraph type visualisations. One might be a comparison of room temperatures another for hot water system temperatures, maybe another for room temperature and electrical or gas energy input?
This feature has now been implemented and is integrated fully into the visualisation selector page. If you have your own emoncms server you can download the latest emoncms from the usual place: github.com/emoncms/emoncms and emoncms.org has also been updated.
Unfortunately due to the large rewrite of the multigraph code the new multigraph is not backwards compatible with the old multigraph, but I hope you will persist with the new implementation as the gains are well worth it. Old multigraphs appear as a list of undefined feeds, my advice is to delete the old multigraph and start with a new one.
Here is a brief walk through of the feature:
1) Start by going to the Vis tab and select the multigraph visualisation from the first drop down menu. In the second box you should now see a select multigraph drop down menu and a new + button. Click on the plus icon to create a new multigraph:

This will refresh the page, navigate again to multigraph in the first drop down menu, you should now see the new multigraph id in the drop down menu. Click/select the new dashboard id:

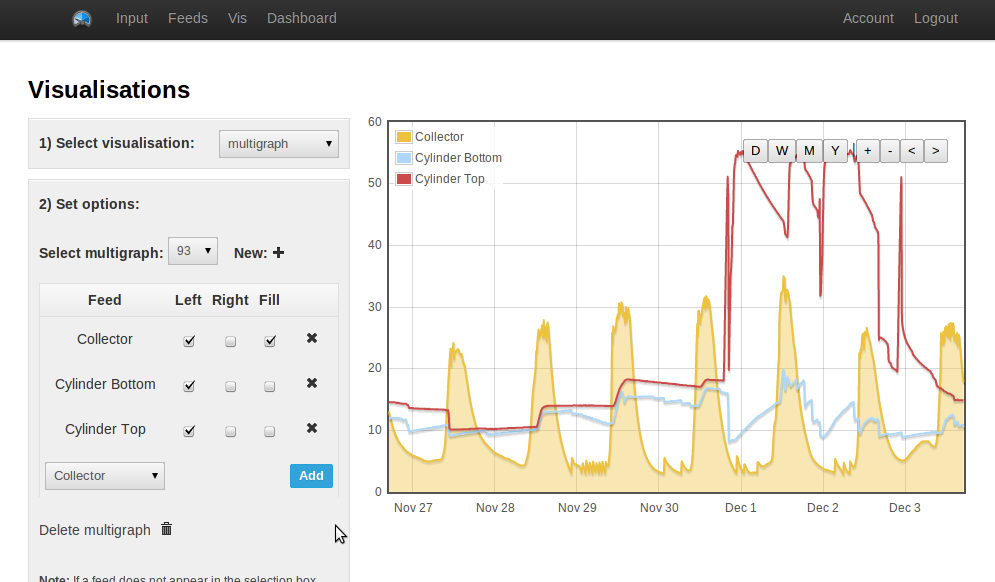
Select a feed from the add feed drop down menu and click on Add, this will add a feed to the multigraph feed list table. Put a tick in the left or right checkbox to specify the axis you wish the feed to appear on, you should now see the feed appear:

Add a few more, put a tick in the fill box to fill in the area below the curve:
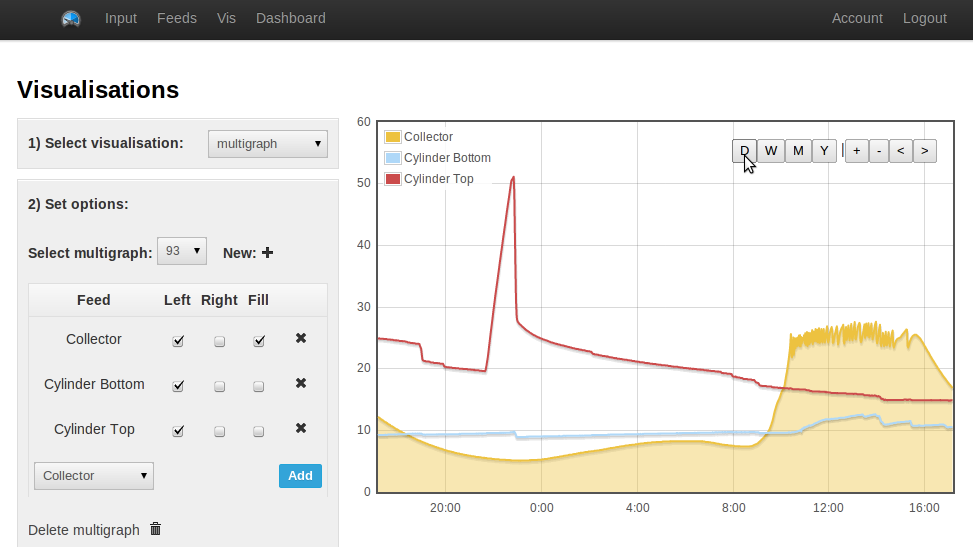
Select a default time range by clicking on the day/week/month/year buttons. When you reload the multigraph it should now appear at the time range given. If you'd like the multigraph to load a specific fixed time range just zoom in on the area you want it to show, the next time you load the multigraph it should load your last view.
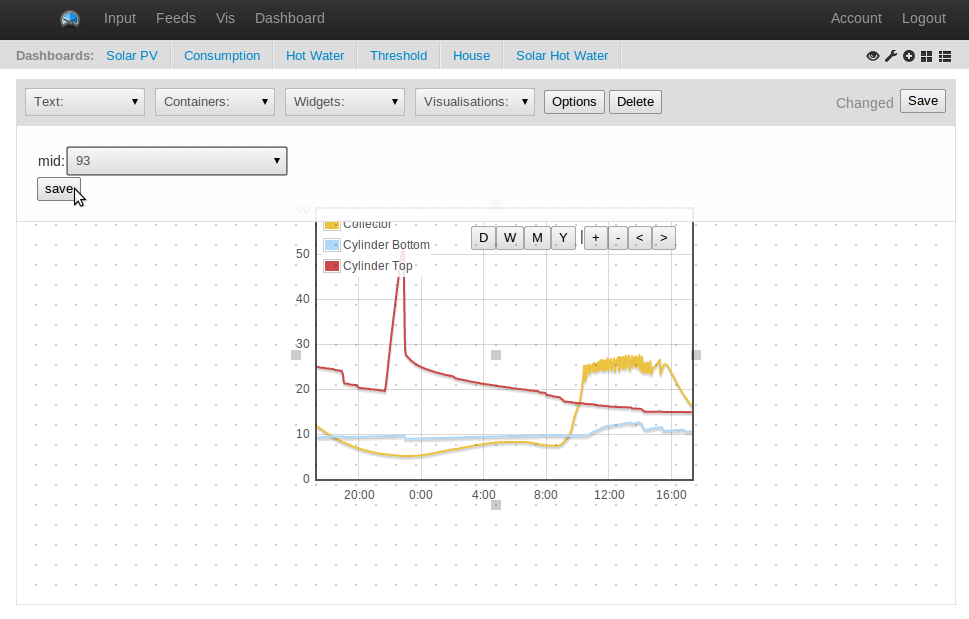
Add a multigraph to your dashboard by selecting multigraph from the dropdown visualisation menu.
Click on the blank dashboard and click on the Options button. Select the multigraph you wish to show from the drop down menu and click save.
Love to hear any feedback on it, whether it worked or didn't work for you, may be worth clearing the cache if it does not work as a few of the javascript scripts have been updated. Enjoy!
To engage in discussion regarding this post, please post on our Community Forum.