Understanding zero carbon energy systems: Energy storage (part 1)
Blog post: Open source hourly zero carbon energy model, combining traditional electric, heating and electric vehicle demand.
How do we achieve that final 10% of supply/demand matching? Is it possible to just scale up the li-ion storage or do we need something else? What is the nature of that final unmet demand and the final storage requirement?
One of the good things about having the model written as a program rather than spreadsheet is that its really easy to run the model iteratively for different input values, you can quickly go through hundreds of model runs. You don’t need to manually run the model for each value.
The following graph shows how the percentage of supply/demand matching increases as the storage size increases. The python source code for the model used to produce this can be found here: https://github.com/TrystanLea/zcem/blob/master/python/storagerequirements.py
In order to capture all of the storage requirement in this analysis the heatstore was removed from the last model and the EV charging was set to a constant charge profile rather than smart charging. This configuration achieves 78.3% supply/demand matching with no storage, an unmet electricity demand of 13,628 kWh over 10 years out of a total of 62,771 kWh.
% Supply/demand matching vs storage size in kWh:
We can see clearly that the degree of supply/demand matching increases very quickly as we add the first kWh's of storage but then the gains taper off quickly requiring orders of magnitude more storage to reach the final 5%.
The first 10% of supply/demand matching, bringing us up to 90% needs around 25 kWh of storage. The next 5% up to 95% requires an additional 120 kWh of storage. The final 5% requires 1536 kWh.
Note: see added section below for calculations of total storage capacity required if the oversupply is 20% or 30% instead of the 4% here.
The first 1.5% of the storage capacity provides 50% of the required supply/demand matching gain.
Its interesting to look at what the use of the 1680 kWh store looks like across the 10 year model period:
The store is used most over winter, where electricity demand is highest due to heatpump space heating. We can see that the winters of 2010 and 2011 where particularly cold and that the extent of the storage requirement in this model is largely driven by these successive harsh winters and a less strong summer. If the modelling had only considered 2002 to 2010 we might have under specified the storage amount needed by half which highlights the importance of modelling over as many years as possible.
Utilisation, cycling
We can see roughly that the full extent of the store is only used once in 10 years and is largely needed to cover just 3.5 months at the start of 2011. Even if the store was half its size it would only be used fully 3 times in 10 years. The extend to which the store is cycled is an important consideration in store choice, both from the perspective of wear and financial payback.
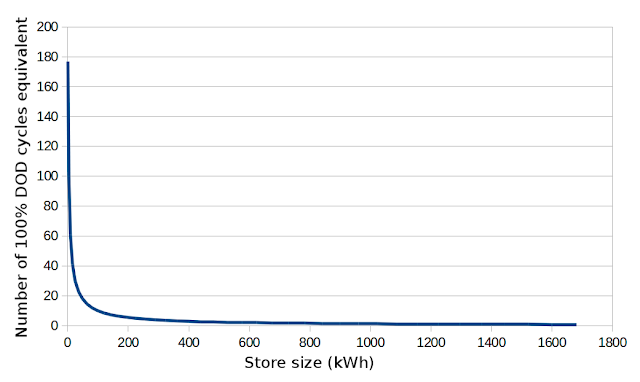
The following graph charts annual cycle requirements vs storage size, highlighting how most of the storage requirement is cycled very infrequently. A 25 kWh store delivers the equivalent charge/discharge energy of 30 full cycles a year, 100% depth of discharge (DOD). The next 120 kWh would only be cycled 7.3 times a year. A 625 kWh store would only be cycled twice in a year and the full 1680 kWh store only 0.8 times a year.
Cycles per year vs store size:
The above gives us an initial degree of insight into the nature of the storage requirements and how reaching the final 10% of supply/demand matching requires magnitude more storage than the first 10%.
Its important to note that the results above are for a model based on uk climate and weather, it would be worth repeating this kind of modelling for warmer countries where air conditioning that matched solar pv generation was a large component of demand rather than winter heating.
The next blog post will look at some of the different storage technologies available and how they are suitable for different segments of the overall storage requirement.
Reducing storage requirements by oversupply
Following the conversation with Dominic Zapman here https://twitter.com/Zapaman/status/627806828865409024, I decided to re-run the model with a higher degree of oversupply - nearer the oversupply level used by ZeroCarbonBritain. The results above are for an oversupply of 4% with 65391 kWh supplied over 10 years for a demand of 62771 kWh. A 1680 kWh store is 27% of the annual demand.
If we re-run the model with an oversupply of 20%, 100% supply/demand matching is reached with a 676 kWh store, 11% of annual demand.
If the oversupply is 30%, the storage requirement is reduced to 484 kWh, 8% of annual demand.
The ZeroCarbonBritain model exports 165 TWh out of the 738 TWh generated which is an oversupply of 22%. A further 180 TWh is used to generate synthetic fuels including power to gas methane storage. A high percentage of this demand will also be oversupply. The long term power to gas storage capacity in ZCB is 60 TWh, delivering on average 14 TWh/year of backup supply covering about 402 TWh of final demand excluding exports. Delivered backup is 3.5% of final demand.
To engage in discussion regarding this post, please post on our Community Forum.


