Emoncms powered by timestore
To recap: timestore is time-series database designed specifically for time-series data developed by Mike Stirling.
Faster Query speeds
With timestore feed data query requests are about 10x faster (2700ms using mysql vs 210ms using timestore). The initial benchmarks I mentioned in previous blog posts show timestore request time to be around 45ms so I still need to investigate the slightly slower performance which may be on the emoncms end rather than timestore.
Reduced Disk use
Reduced Disk use
Disk use is much smaller, A test feed stored in an indexed mysql table used 170mb, stored using timestore which does not need an index and is based on a fixed time interval the same feed used 42mb of disk space.
In-built averaging
In-built averaging
Timestore also has an additional benefit of using averaged layers which ensures that requested data is representative of the window of time each datapoint covers.


To engage in discussion regarding this post, please post on our Community Forum.
Due to the integration of averaging in timestore there are significant implications for input processing and visualisations. Rather than compute kwh/d data from power data in an emoncms input process this can now be moved to timestore by querying timestore for average power in a day and converting this value to kwh/d by multiplying the average power by 0.024.
This means we no longer have two feeds one for kwh/d data and another for power data which changes the way many of the visualisations need to work. Visualisations such as simple zoomer need to query the same feed at different average levels.
To fully integrate timestore in emoncms and reach a similar level of input process and visualisation options is a big task. To simplify things, the current release has cut down functionality with only a few input processes and visualisations.
To create feeds with a fixed datapoint interval I added an interval selector to the input processing configure input page:

The data point interval is displayed as a field in feeds page:

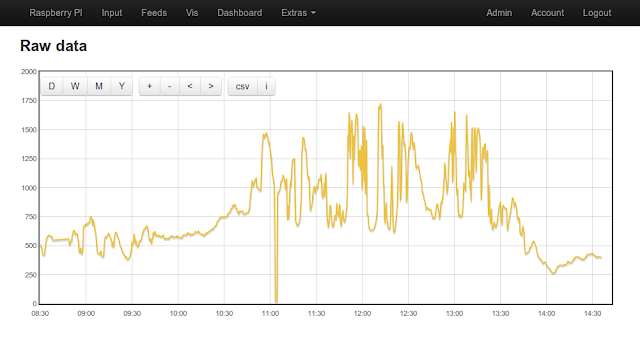
Example of timestore working displaying solar production here over the last few hours:

Try it out following the instructions here for installation on a raspberrypi:
Next I intend to test the histogram datatype, ensure that works ok. The input processors for plus, minus, divide and multiply by another input also need looking at and then the more complex kwhd to power feed type zoomer visualisations. If a timestore version of emoncms is useful for you and your interested in helping to get it working well, I would be glad to have your help.
Blog posts on emoncms data storage for further context:
http://openenergymonitor.blogspot.co.uk/2013/06/timestore-timeseries-database.html
http://openenergymonitor.blogspot.co.uk/2013/06/rethinking-data-input-and-storage-core.html
http://openenergymonitor.blogspot.co.uk/2013/07/more-direct-file-storage-research.html
http://openenergymonitor.blogspot.co.uk/2013/06/timestore-timeseries-database.html
http://openenergymonitor.blogspot.co.uk/2013/06/rethinking-data-input-and-storage-core.html
http://openenergymonitor.blogspot.co.uk/2013/07/more-direct-file-storage-research.html