Removing redundant datapoints – algorithm 1
You could probably say that the aim of an algorithm that removes redundant datapoints is to create a line plot who's standard deviation compared to the raw data line is as small as possible while minimising the number of datapoints. This is probably a good rough criteria for evaluating a prospective algorithm.
Here's one idea for an algorithm, I think it can certainly be improved upon but its a start.
If we start with our monitor that's posting once every 10 seconds. If we note down the first datapoint received and then as subsequent datapoints come in draw a line between the first and the last datapoint.

Then lets say there is a step change, a light goes on, suddenly the line is much higher than the actual data for most datapoints:
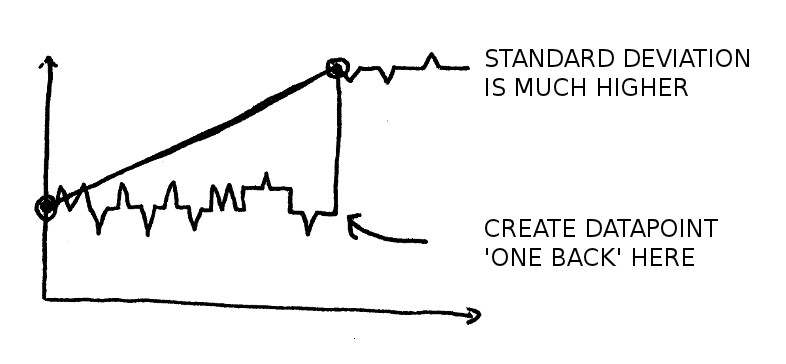
If we measure the standard deviation of the raw datapoints vs the line to begin with it will be small, once that step change happens it will become much larger.
At this point we note a significant change has happened (stdev is larger than a threshold) and create a datapoint one back from the last datapoint (the bottom of the step).
We can then move our 'start' datapoint forward to this created datapoint and repeat the process. This should do a pretty good job of tracking the raw data.
To test it I have created a visualisation that applies this algorithm using javascript in the browser here is the result:
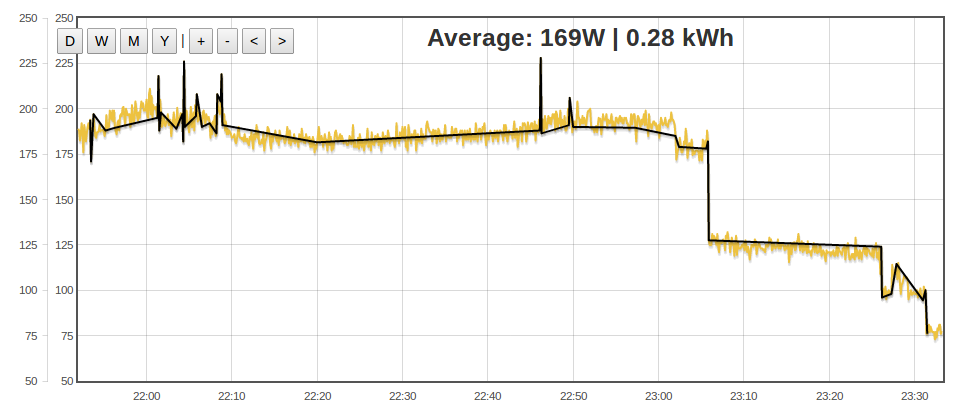
It works pretty well reducing 1064 datapoints to 52, but it does look messy in places.
To try out the code for the above, make a backup of the script:
emoncms/Modules/vis/visualisations/rawdata.php in your local emoncms installation.
and replace with this:
If you can think of a good algorithm to do this, It would be great to hear about it.
To engage in discussion regarding this post, please post on our Community Forum.