How to draw a myelectric style bar chart
Both the myelectric emoncms module and the soon to be myelectric android app have a bar chart that is written using the 2d graphics canvas. This short guide details how the bar chart is built and the first part is written to be applicable for different programming languages with examples in each particular language to come at the end, there's one for android java canvas at the moment.
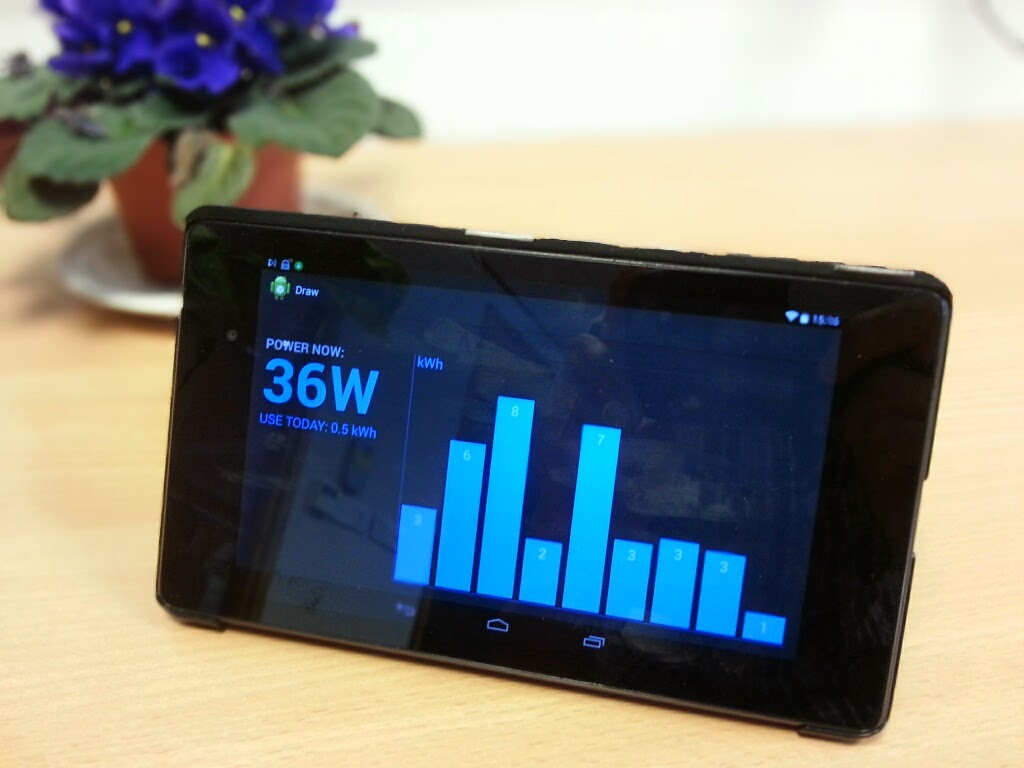
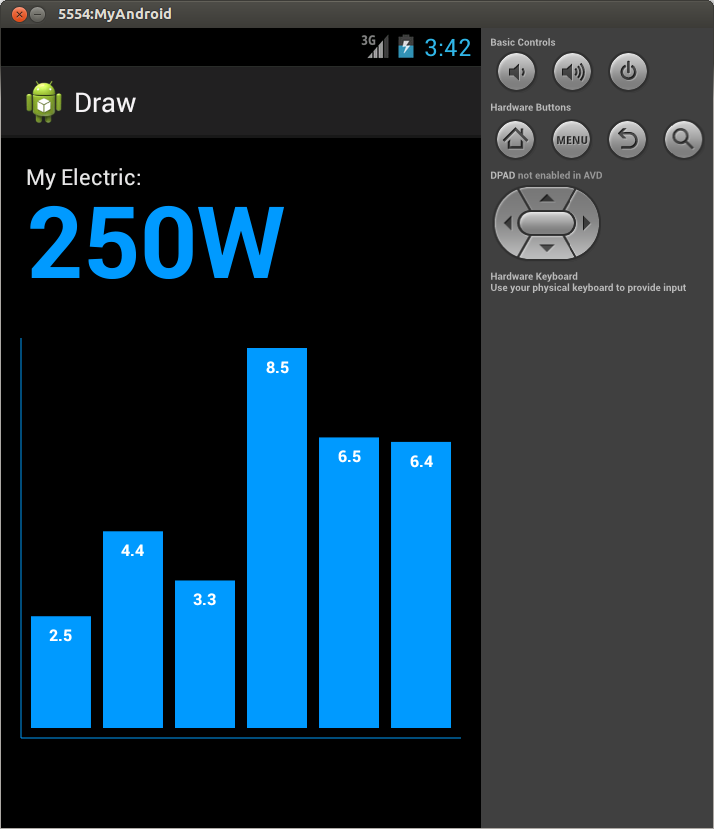
Writing custom graphs is not as complicated as I initially imagined it to be. Once you have a grasp of 2d graphics canvas sometimes its easier to write your own graph to get the style that you want. The myelectric graph was written from scratch in order to achieve a precise look: simple color scheme, bar height values overlayed on the bar, kWh label in the top-left corner.
Tutorial: How to draw a myelectric style bar chart

To engage in discussion regarding this post, please post on our Community Forum.