From 1.3 minutes to 196ms: timestore on emoncms.org
John Cantor who uses the openenergymonitor system for heatpump performance monitoring got in contact the other day saying that graphs on emoncms.org where taking a really long time to load. I said that the work on using timestore will soon speed things up significantly. He asked if there was a chance to convert the feeds before he went up to work on a system in Scotland as being able to zoom with speed through the graphs would make a big difference.
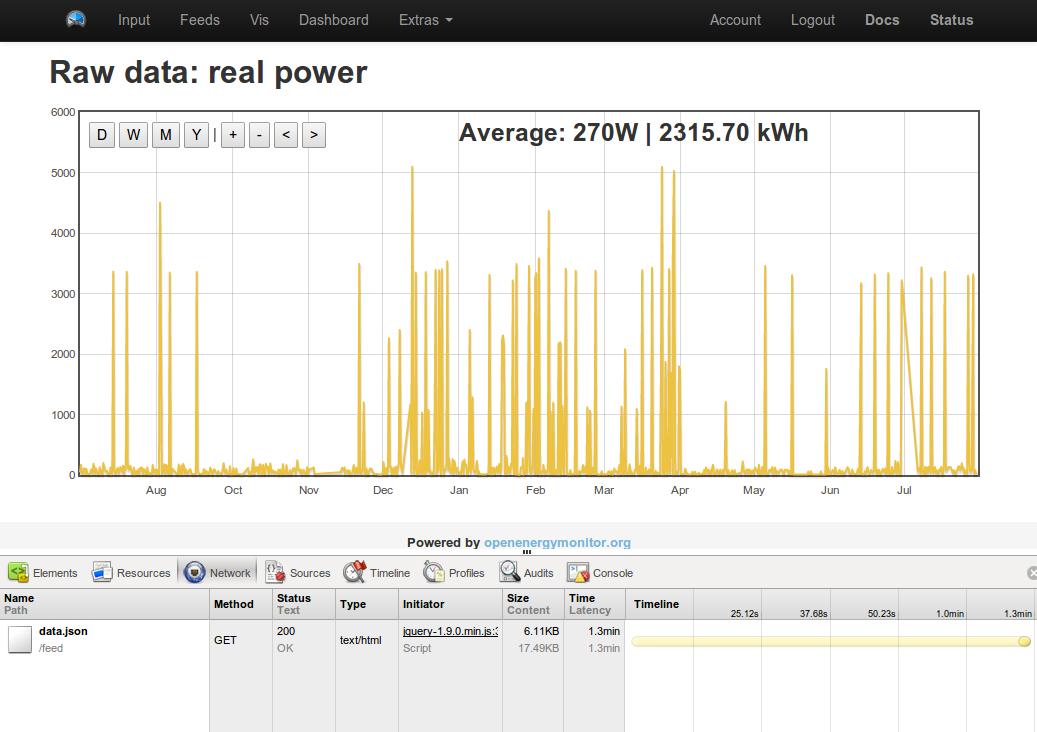
Clicking on the Y (Year) button in the rawdata visualisation has slowed down so much over the last year that it now takes over a minute to load the view.
The same request on a raspberrypi takes 2.9 seconds, The thinking to why its so much slower on emoncms.org is because of the use of the php loop doing individual requests to mysql which are added to the mysql process queue and have to wait in line amongst all the other mysql inserts and updates caused by all the updating feeds, the php loop method was initially faster than an equivalent mysql implementation but clearly not for long.
Anyway I figured we could get timestore up and running on emoncms.org straight away if we run timestore in parallel with the current mysql storage and then slowly convert feeds over to timestore over time. The present input processing and visualisation implementation would be kept as is for the time being only initially using timestore to replace the realtime datatype rather than both realtime and daily.
Conversion from mysql to timestore takes a long time especially as the process has to be throttled down in order to allow enough resources on the server for normal operation to continue. For example the conversion of a 568 day long, 5s datapoint interval feed (~152mb) takes about half an hour loading the server to an average 15min (quite high) load of 4.69 at that rate it will take about a month to convert all feeds over to timestore.
The results though are worth it!:

196ms!
1.3 minutes down to 196ms is a 398x speed increase! and its also possible to see another advantage of timestore the effect of the average layers showing a slight winter summer curve. A big thankyou and credit to Mike Stirling for developing timestore enabling this kind of performance, if you haven't already check out the timestore project website:
John Cantor has shared the Scottish heatpump dashboard publicly, take a look to try out the new timestore feeds:
Im currently working on an interface in emoncms to allow selection of the feed datapoint interval (5s, 10s, 30s etc) to convert to before the feeds are added to the conversion queue, more on this soon.
To engage in discussion regarding this post, please post on our Community Forum.